
Recently I’ve done a bit of work for Hasura, investigating
some strange memory behavior in
graphql-engine. When measuring
memory usage, we can ask the operating system (OS) how much memory our process
is using, but we can also use the GHC runtime system’s (RTS) heap profiler. After running a
graphql-engine benchmark, the server’s memory usage reported by the OS was much
higher than the “heap residency” reported by GHC’s heap profiler. This led
us down a bit of a rabbit hole of understanding memory allocation and memory
fragmentation in programs compiled with GHC.
In this blog post, we look at memory fragmentation in the Haskell heap and how it arises. We look at how fragmentation affects the discrepancy between heap residency reported by the RTS and memory usage reported by the OS. In particular, we focus on a pathological case of a program that makes use of pinned data and transitions from high heap residency to relatively low heap residency.
Memory Metrics
On Linux there are multiple ways to measure memory usage of a process, but the
one we’ll focus on is virtual memory resident set size, VmRSS. This can be
sampled from /proc/<PID>/status where <PID> is a process ID. We won’t get
into the details of this, but suffice it to say that we consider VmRSS the
“true” memory usage of our Haskell program.
Heap residency is a measurement taken by the runtime system’s heap profiler. It measures
the size of all live data on the Haskell heap. VmRSS is always higher than
heap residency. The reason is that heap residency is only a measure of live
data on the Haskell heap while VmRSS is “all inclusive”. The GHC user’s guide gives the
following reasons for a higher VmRSS:
- Overhead due to a profiled build. Each heap object uses an extra 2 words that are usually not counted in the heap profile.
- Garbage collection. The copying collector (i.e. the default collector) makes a copy of all live unpinned data causing a peak in memory usage.
- Thread stacks are not counted in the heap profile by default. Profiling with the
-xtruntime system option includes stacks in the profile. - The program text itself, the C stack, any “non-heap” data (e.g. data allocated
by foreign libraries and data allocated by the RTS itself), and
mmap()’d memory are not counted in the heap profile.
In the following section is an example program which we focus on for this blog
post. We’ll dive into the details shortly, but this program exhibits much
higher VmRss than heap residency, so let’s consider why this might be:
We’re not using a profiled build, so point 1 does not apply.
In general, stack usage can be significant and you should profile with
-xtto diagnose this. The example program has negligible stack size, so point 3 also doesn’t apply.The runtime system (RTS) is written in C and has it’s own stack and non-heap data, but this is negligible compared to the large amount of data we’re allocating on the Haskell heap. The program text is small and we’re also not calling any foreign code nor
mmap()’ing any memory, so point 4 doesn’t apply.1
That leaves point 2 which is certainly applicable, but there is another reason that the above list does not mention: fragmentation.
Another metric from the RTS is the heap size. Heap size is an all inclusive
metric of the Haskell heap. It includes fragmentation. VmRSS and heap size are
about equal in our example program.2 Comparing VmRSS and
heap size is a good way to check if the memory usage is truly in the Haskell
heap or if there are other issues as listed in point 4.
Kilobyte vs Kibibyte
As we’re closely counting bytes, we should make clear the awkward situation that
memory is sometimes reported in base 10 units (e.g. kilobyte (kB) = 1000 bytes)
and sometimes in base 2 units (e.g. kibibyte (KiB) = 1024 bytes). To make it
worse, the “i” used in the symbols for base 2 units (e.g. “KiB”) is
often omitted so they look just like the base 10 counterpart (e.g. “KB”).
Confusingly, /proc/<PID>/status says “kB” but means “KiB”. The eventlog2html output says “G”, “M”, and “K” but
means “GB”, “MB”, “kB”. The debugging output from the -Dg RTS option prints “MB” but
means “MiB”.3
With the exception of the heap profile graphs (generated with
eventlog2html), all numbers in the blog post will be in base 2: gibibyte (GiB) =
1024 MiB, mebibyte (MiB) = 1024 KiB, and kibibyte (KiB) = 1024 bytes.
Example
Let’s consider the following application that allocates a list of ByteStrings
and then retains a smaller 1/10th subset of them:
-- Main.hs
{-# LANGUAGE BangPatterns #-}
{-# OPTIONS_GHC -Wall #-}

import Control.Concurrent (threadDelay)
import Control.DeepSeq (force)
import Control.Monad (forM_)
import qualified Data.ByteString as BS
import System.Mem (performGC)
import System.Environment (getArgs)

main :: IO ()
main = do
  n <- read . head <$> getArgs

  -- Allocate lots of ByteStrings (ByteStrings are backed with pinned data)
  let !superset = force $ take n [BS.singleton x | x <- cycle [minBound..maxBound]]
  putStrLn "1st Plateau start"
  spin 3

  -- Extract only a small subset of the superset and allow superset to be
  -- garbage collected. Specifically retain every 10th element.
  let subsetFactor = 10 :: Int
  let !subset = force $ [x | (x, 1) <- zip superset (cycle [1..subsetFactor])]
  putStrLn "2nd Plateau start"
  spin (3 * subsetFactor)

  -- Stop `subset` from being garbage collected by using it here.
  print (length subset)

-- Spin and allow heap profiler to collect samples.
spin :: Int -> IO ()
spin i = forM_ [1..i] (\_ -> threadDelay 1 >> performGC)
Compile with ghc -rtsopts -eventlog -debug Main.hs and run with
./Main 10000000 +RTS -s -Dg -hT -l --disable-delayed-os-memory-return -RTS. The
-hT -l options produce an eventlog with a memory profile that we can be
visualized with eventlog2html. The -Dg option prints garbage collector
statistics to standard error. The --disable-delayed-os-memory-return option is
explained later.
Consider what we expect when running a heap profile. The program should allocate
some memory then spin a bit. Next, superset is garbage collected and we’re left with
subset. We expect heap residency to drop to 1/10 of the size. After spinning
for some more time the program will exit. That’s what we expect. Here is what
the heap profile shows:

The majority of memory is PS, ARR_WORDS, :, and PlainPtr.
These are the type constructors found in a list of ByteString. PS is the ByteString constructor and PlainPtr and
ARR_WORDS are internal to ByteString. We see that allocating superset
results in about 1.04GiB (1.12GB) of heap residency corresponding to the first plateau in
the heap profile between 27 and 39 seconds. After this, we take 1/10 of that
data, subset, and allow the rest of superset to be garbage collected. Hence, we expect
the heap residency to drop to about 1/10 of the size, 0.10GiB (0.11GB), but this is not
what the profile shows! Heap residency decreases only to about 0.37GiB (0.4GB) and all of
ARR_WORDS is unexpectedly retained.
This is not some subtle mistake in the
code causing ARR_WORDS to be retained. This is in fact due to how the RTS
handles pinned memory. Let’s look at the memory residency reported by the
operating system. I sampled the VmRSS reported in /proc/<pid>/status every
0.01 seconds:

The VmRSS has some discrepancies with the heap profile. The OS is reporting
about 1.84GiB of memory at the first plateau. That’s almost 1.8 times more than
the heap profile. In synch with the heap profile, between 40 and 61 seconds,
there is a second plateau where VmRSS is about 1.5GiB. That’s about 4 times more
than the heap profile. So not only is the VmRSS significantly higher than heap
residency on the first plateau, but the discrepancy is much worse on the second
plateau.
The Heap
In order to make sense of the memory profile we need to understand the structure of GHC’s Haskell heap, how allocation works, and a bit about garbage collection. I’ll give a simplified overview of this. In particular I’m ignoring megablock/block groups, block descriptors, and am only considering the oldest garbage collector generation. I’m also assuming that the default copying garbage collector is in use.
Megablocks, Blocks, and Objects
The Haskell heap is made up of 1MiB “megablocks”. Within those are 4KiB “blocks”. Within those blocks are the actual data objects. Blocks are designated as exclusively containing either pinned or unpinned data. Here is an example of what the heap might look like in virtual memory space:


This is not to scale. In reality a megablock contains many more blocks, a block typically contains many more objects, and objects can vary in size. Notice that megablocks are not necessarily contiguous within virtual memory space. We call the unused gaps between megablocks “megablock level fragmentation”:

Likewise the unused gaps between blocks within megablocks is called “block level fragmentation”:
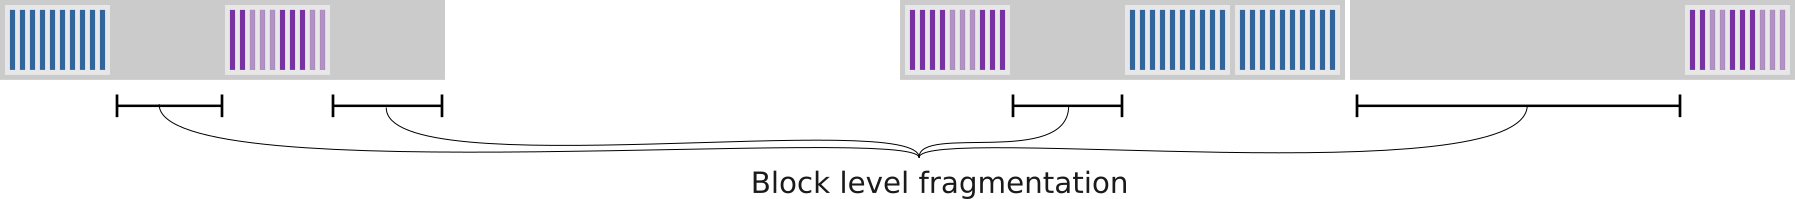
Dead objects within blocks are called “object level fragmentation”:

Note that some blocks have some unused space at the end because we have yet to add objects there or there was not enough space to add an object so the RTS allocated a new block instead. That extra space is called “slop” and we don’t count this as object level fragmentation. We mostly ignore slop for this post.
Pinned Data
What is pinned data? Thanks to referential transparency, the memory address of
an object in Haskell is usually not important. This permits the RTS’s default
copying garbage collector to move objects around in memory i.e. changing their
memory location. In practice, we may want a chunk of memory that won’t be moved
by the RTS. The most obvious example is when passing data to foreign code. The
foreign code won’t be very happy if the RTS suddenly moves that data. As such,
GHC supports the notion of “pinned” data which can be allocated via GHC.Exts.newPinnedByteArray#
and similar variants. Pinned data is guaranteed not to be
moved by the RTS. We refer to all other data as “unpinned”. Note that “large
objects”, objects larger than 8/10 of a block, are also treated as pinned data.
ByteString, used
in the example above, uses pinned data under the hood. Pinned data can also be
found in the hashtables and cryptonite packages as well as the vector
package where pinned data is used for storable vectors.
Allocation
Allocating memory happens in a few layers. At the bottom, there is the OS from which the RTS ultimately asks for memory within the virtual memory address space. On top of that is the RTS’s megablock allocator, which allocates memory from the OS in units of 1MiB megablocks. The megablock allocator handles allocating and freeing megablocks, but it is ultimately the block allocator that requests new megablocks from the megablock allocator, and the garbage collector that instructs the megablock allocator to free megablocks. It’s technically possible that a single object of only a few words in size is keeping alive a whole megablock. The megablock allocator keeps track of freed megablocks and reuses the freed space when allocating new megablocks. It always picks the leftmost free space when allocating new megablocks (i.e. with the lowest memory address).
Each megablock truly reserves a MiB of physical memory that cannot be used by
other processes. Regardless of their contents, the total number of megablocks
is ultimately what the OS counts toward VmRSS. Also note that megablock
level fragmentation does not correspond to fragmentation of physical memory.
Megablocks are in virtual memory space. So the OS effectively maps megablocks to
physical memory and is able to compact that memory when and if fragmentation in
physical memory space becomes an issue. In other words, megablock fragmentation
doesn’t matter, only the total number of megablocks counts towards VmRSS.
By default the megablocks are returned to the OS lazily. This means the OS may
delay freeing the memory e.g. until there is memory pressure. That makes
reallocating not-yet-freed memory cheap, but this obfuscates the VmRSS
measurement. By using the --disable-delayed-os-memory-return RTS option,
memory is returned eagerly and VmRSS closely tracks the total number of
megablocks. This gives more meaningful VmRSS measurements, but can decrease
performance so is not recommended for normal use.
One level up is the RTS’s block allocator, which allocates memory from the megablock allocator in smaller units, namely (groups of) 4KiB blocks. The block allocator keeps track of all “free” blocks, i.e. the block level fragmentation. When allocating a block, if no free block exists then a new megablock is requested from the megablock allocator, else a freed block is reused. Picking a free block is not necessarily done in lowest memory order (unlike for megablocks). The location of new blocks is influenced by a few factors including the pattern in which previous blocks were freed. I will not attempt to describe this in detail, but we can consider the location of new blocks to be mostly arbitrarily. What is guaranteed is that if a free block exists then it is reused rather than a new megablock being requested.
On top of the block allocator, the program runs and allocates objects.4 Each thread has a current pinned block and a current unpinned block. New pinned/unpinned objects are placed in the current pinned/unpinned block respectively in a bump pointer fashion. This means the blocks are packed tightly with objects from left to right. When the current block is filled, a new block is requested from the block allocator and the process continues. Again, the block allocator allocates this block into a somewhat arbitrary location in memory likely not contiguous with the previous block.
Garbage collection
Eventually garbage collection occurs. I’m assuming the default copying collector is in use. The garbage collector works by scanning all blocks and copying live unpinned data to new blocks. At this point we’ll reach a peak in memory usage, storing:
- all dead pinned data;
- all dead unpinned data;
- all live pinned data; and
- 2 copies of all live unpinned data.
Next, the garbage collector frees all blocks except the live pinned blocks and the new copy of live unpinned data. Hence the garbage collector has fulfilled its task of freeing dead data. Note that when copying the live data, this is done again in a bump pointer fashion within blocks, requesting new blocks as necessary. Hence the new copy of live data is naturally “compacted” i.e. there is no object level fragmentation in the new blocks. This eliminates object level fragmentation of unpinned data and is great for performance.
Finally, the garbage collector may ask the block allocator to free some megablocks. This is
ultimately how the RTS returns memory to the OS. To add to the confusion,
regardless of the --disable-delayed-os-memory-return flag, the garbage collector
estimates how many megablocks are needed for the next garbage collection and may avoid
freeing megablocks even if more could be freed. This is done to
avoid the cost of returning/reallocating memory from the OS.
Because the garbage collector deallocates a large amount of blocks, those deallocated blocks result in block level fragmentation. In practice, due to frequently allocating objects, regularly performing garbage collection, and because the locations of new blocks are somewhat arbitrary, the blocks we end up deallocating tend to be interspersed with other retained blocks.
For pinned blocks, object level fragmentation remains after garbage collection because pinned objects cannot move and hence cannot be compacted. What’s worse is that the free space in those pinned blocks is not be available until all objects within are dead and the block is freed as a whole. That’s because allocation works in a bump pointer fashion rather than attempting to refill object level fragmentation.
The end result after garbage collection is a heap with compacted unpinned blocks, uncompacted pinned blocks, and some block level fragmentation. Here is an example of a heap before garbage collection, after copying live unpinned data, then after garbage collection:
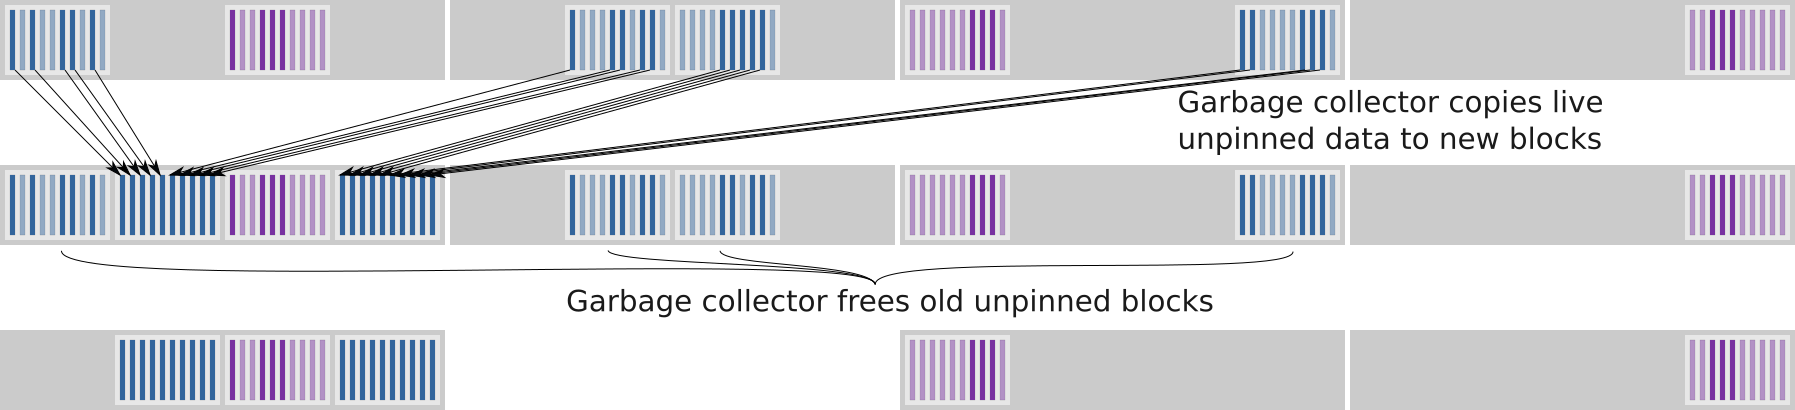
A key thing to note in this example is that block level fragmentation exists at
the start of the GC cycle, and it allows us to fit all copied live data into the fragmented
spaces. Hence we avoid allocating more megablocks and VmRSS doesn’t increase
during garbage collection. In fact, in the final step, a megablock is freed meaning VmRSS will
decrease.
Understanding the Example Program
Let’s have a look at the example program again. I’ve copied the Heap and VmRSS
profiles here for your convenience:

The First Plateau
Let’s look at the first plateau in the memory profile (27s - 39s). We’re running
spin while retaining superset. VmRSS is about 1.84GiB while heap residency
is about 1.04GiB. This discrepancy can be explained by looking again at the
-Dg output,5 specifically the total number of blocks and the free blocks:
Memory inventory:
  ...
  gen 1 blocks : 281281 blocks (1098.8 MiB)
  ...
  free         : 191705 blocks ( 748.8 MiB)
  ...
  total        : 473256 blocks (1848.7 MiB)
The “total” (i.e. the heap size) is about equal to VmRSS which confirms that
memory outside of the Haskell heap is negligible. Most live data is in “gen 1”
which is 1098.8 MiB. This is a bit more than heap residency as it includes slop.
The “free” blocks correspond to block level fragmentation, of which there is
plenty, taking up about 40% of the total number of blocks. It’s this
fragmentation that explains the discrepancy between VmRSS and heap residency.
Since spin is repeatedly invoking the copying garbage collector, why is VmRSS stable
throughout the plateau? As we’ve seen in the previous section, this is possible
because the copied objects are placed in the fragmented “free” blocks, so new
megablocks are not necessarily needed.
Remember, only the live unpinned data is copied during garbage collection. From the heap
profile we see about 305.2MiB (= 320MB) of ARR_WORDS which is the pinned data
used by ByteString. That leaves 762.9MiB (= 800MB) of live unpinned data. That
almost fits into the 748.8MiB of free blocks reported by -Dg. It’s not a
coincidence that the size of free blocks is about equal to the size of unpinned
live data. It is rather a consequence of previous garbage collections.
There is one problem here. We have about 14.1MiB more live unpinned data than we
have free blocks. Hence we expect garbage collection to allocate more megablocks while copying the
unpinned live data, but VmRSS does not change in the first plateau. After
instrumenting GHC, I confirmed that no new megablocks are allocated. Where is
the RTS copying these 14.1MiB to? This is currently still a mystery.
The Second Plateau
Now we understand the first plateau, but the second plateau is a bit more
interesting. Why on earth aren’t any of the ARR_WORDS objects garbage
collected? I assure you, they truly are dead objects that were owned by now
dead or garbage collected ByteStrings.6
The reason they appear in the heap profile is down to a
quirk in the RTS. The heap profiler makes no attempt to account for dead objects
in pinned blocks, but instead counts the entire pinned block as live
ARR_WORDS as long as any object within is live.7 Another way to
look at this is that pinned object fragmentation is counted as ARR_WORDS in
the heap profile.
The question now is why do we have so much pinned object level fragmentation.
This is because we specifically “strip” elements from superset to create
subset:
let !subset = force $ [x | (x, 1) <- zip superset (cycle [1..subsetFactor])]Let’s imagine that the heap looks like this in the first plateau, retaining all
of superset:

Then we “strip” out the subset so many objects are now dead:

Finally garbage collection is performed:

Even though 9/10 of our objects are dead we only managed to deallocate about 1/4
of our megablocks. The problem is that the pinned blocks can’t be moved; they
are pinned. That means the dead objects inside are left as pinned object level
fragmentation explaining the unexpectedly high ARR_WORDS in the heap profile.
Another important point is that the megablocks containing pinned blocks can’t be
freed even though there is ample unused space (i.e. block level fragmentation).
This means the pinned blocks are causing more block level fragmentation. We can
corroborate this this with the -Dg output in the second plateau:
Memory inventory:
  ...
  gen 1 blocks : 97874 blocks ( 382.3 MiB)
  ...
  free         : 287668 blocks (1123.7 MiB)
  ...
  total        : 385812 blocks (1507.1 MiB)
Compared to the first plateau where 40% of the total blocks are free, in the
second plateau 75% of the total blocks are free. This confirms a high level of
block level fragmentation in the second plateau and explains the larger
relative discrepancy between heap residency and VmRSS in the second plateau
compared to the first plateau.
Take Instead of Strip
Let’s test our understanding a bit further by changing the example program and
seeing how it affects memory usage. Instead of constructing subset by
“stripping” out every 10th object from superset, we can just “take” the first
10th of superset:
let subsetFactor = 10 :: Int
let !subset = force $ take (n `div` subsetFactor) superset
Think about how this affects the distribution of retained pinned objects.
Rather than retaining a small number of objects from each pinned block, we are
now retaining full pinned blocks. Imagine the heap looks like this while
retaining superset:

We then use our new take version of subset so many objects are now dead but
with a different distribution than the “strip” version:

Finally garbage collection is performed:

Compared to the “strip” version, the “take” version managed to deallocate more megablocks. The pinned objects retained by the program are closely packed. Hence we’re avoiding object level fragmentation in pinned blocks. That results in fewer pinned blocks compared to the “strip” version. Fewer pinned blocks means fewer megablocks and less block level fragmentation.
The “take” and “strip” versions retain the same amount of live objects, but the
“take” version will have a heap profile with more sensible values for
ARR_WORDS and will have lower VmRSS in the second plateau. Indeed that’s what
we see. Here is the take version:

And here is the strip version again:
Conclusion
To summarize, memory usage reported by the OS can be significantly larger than
the heap residency reported by GHC’s heap profiler. This can sometimes be caused by object
and block level fragmentation. Fragmentation can be diagnosed by observing a
discrepancy between heap residency and heap size or virtual memory resident set
size (VmRSS) reported by the OS, after allowing for garbage collection
overheads. The discrepancy is particularly bad when a program allocates lots of
pinned data, then frees some of it. To make matters worse, dead pinned objects are not
freed during garbage collection if any live pinned object exists in the same
memory block.
One could reduce fragmentation and hence VmRSS by reducing retention of pinned data.
For example, the bytestring package provides ShortByteString which uses
unpinned data under the hood. There is also some talk already of making
ByteString unpinned, although this is a nontrivial task.8
When trying to
reduce the use of pinned objects the main difficulty is identifying the pinned
objects being retained in the first place. A heap profile may show the presence of ARR_WORDS,
but that isn’t necessarily pinned data nor does it tell much about where such
objects are created and retained in your code. I’ve also had little luck with
retainer
profiling
when diagnosing these issues. This comes down to a lack of tooling.
Something allowing analysis and exploration of the heap as a graph of objects
would be invaluable in this scenario. With the recent progress on
ghc-debug, such a tool should be
within reach.
Well-Typed has a longstanding interest in these issues. If you or your company are interested in better tooling and might be able to provide funding to enable some of these improvements, then we’d love to hear from you at info@well-typed.com.
Finally, we at Well-Typed would like to thank Hasura for allowing use to publish this blog post, much of which which is the result of work done for them on graphql-engine.
Also note that
mmap()’d memory doesn’t count towardsVmRSSanyway.↩︎The easiest way to observe heap size is to generate an eventlog by running with the
-lRTS option, then opening the eventlog file with ThreadScope and clicking on the “heap” tab.↩︎Merge request !3813 should correct the
-Dgoutput to printMiB.↩︎Actually, objects are “evacuated” from the younger generation during garbage collection, but that’s not necessary to understand for this blog post.↩︎
An issue that sometimes arises with
ByteStringis that retaining a small slice of a largerByteString(e.g. created bytake) can cause the entire underlying byte array to remain live. This isn’t the case in our example since we don’t use slicing operations. It can be avoided by judicious use ofcopy.↩︎There is an open issue to give more detailed information about pinned data in heap profiles (#7275).↩︎
See bytestring issue #193 and GHC issue #13630 for discussion of unpinning
ByteString.↩︎