
GHC 9.4 contains a new cost-centre insertion strategy which provides more detailed profiling reports without affecting the optimisation of the program. The idea is to insert cost-centres after the optimiser has run so that the optimiser can’t be affected by the cost centres. The downside of this approach is that some cost centres will have internal names, but the profiles are still understandable and useful.
Using late cost centre profiling
The GHC user’s guide chapter on profiling explains the background:
GHC’s profiling system assigns costs to cost centres. A cost is simply the time or space (memory) required to evaluate an expression. Cost centres are program annotations around expressions; all costs incurred by the annotated expression are assigned to the enclosing cost centre. Furthermore, GHC will remember the stack of enclosing cost centres for any given expression at run-time and generate a call-tree of cost attributions.
As with any cost-centre profiling the first thing that you need to do is compile
your application with profiling enabled. For a cabal project, you can do this
by modifying the cabal.project file.
# cabal.project

profiling: True
and then with a recent version of cabal (3.10.1.0) you can directly use the
profiling-detail field:
profiling-detail: lateIf you are using an older version of cabal, you should disable the default insertion of cost-centres,
and turn-on the insertion of late cost centres using the ghc-options flag instead:
profiling-detail: none

package *
  ghc-options: -fprof-late
With these changes, GHC will insert cost centres after optimisation. These cost centres result in a profiling report that maps more closely to the behaviour of the non-profiled program (compared to other strategies for cost centre insertion, which insert cost centres before optimisation).
Profiling your executable
Now that the executable is built with profiling, we can run it to produce the profiling report.
cabal run executable -- +RTS -pjOnce the executable has finished running, the executable.prof file will contain
a JSON document which records the profiling information from that run of the program.
The document can be understood by a variety of tools, but the best visualiser in our experience is speedscope.app. Load the profile into the web interface and you can now start to understand the profile.
Understanding the profile
As an example, let’s look at profile of GHC itself, showing time spent compiling
the Cabal library. The resulting ghc.prof file was loaded into speedscope to
visualise the profile.
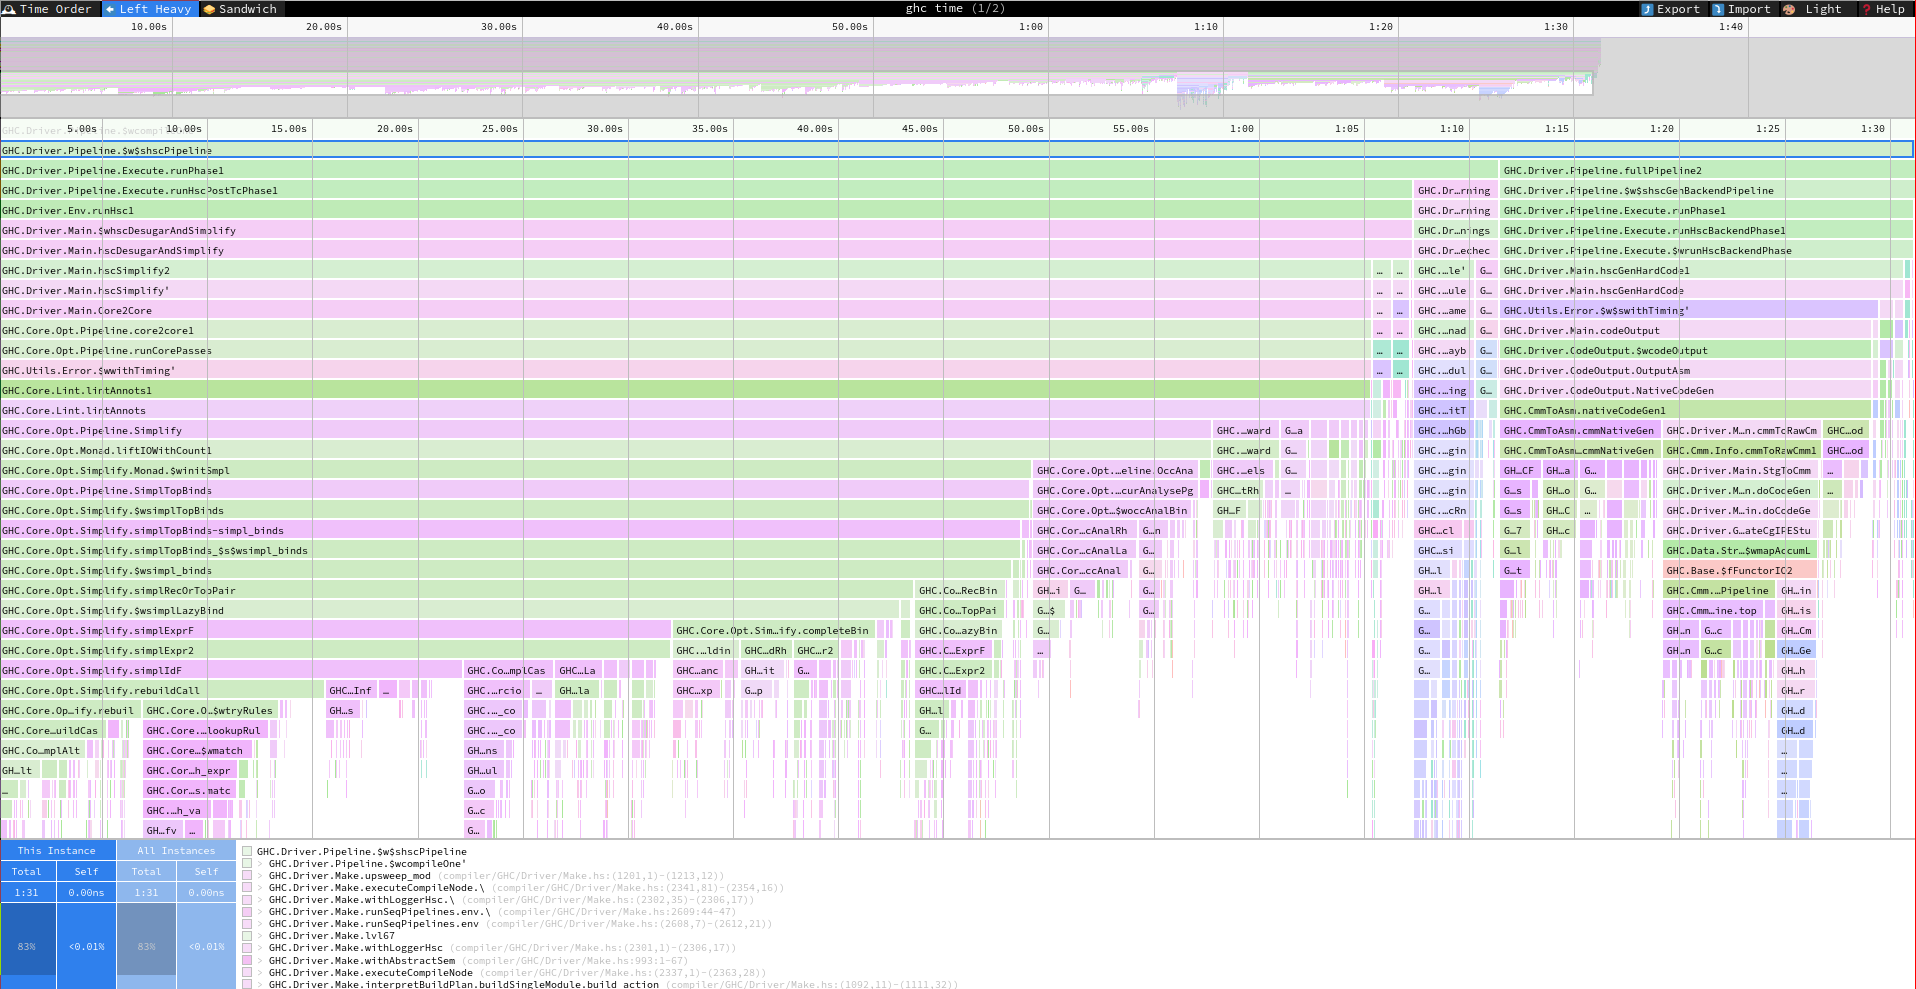
The main thing to notice about the profile is that the call stacks are much deeper than normal cost-centre profiles, because the insertion strategy has inserted more cost-centres.
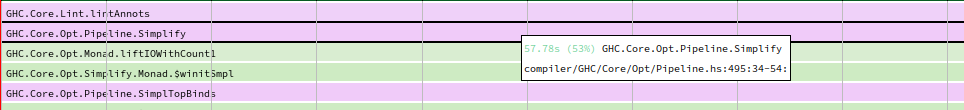
From the profile, we can hover over each cost-centre and see how much time was spent in that portion of the program. For example, about 53% of time was spent in the optimiser.
If you double click on a band then the profile zooms to that specific region. In
this view, you can see more clearly which parts of the simplifer are taking up time.
For example, you can see that rule matching ($wtryRules) accounts for 6% of total
runtime.
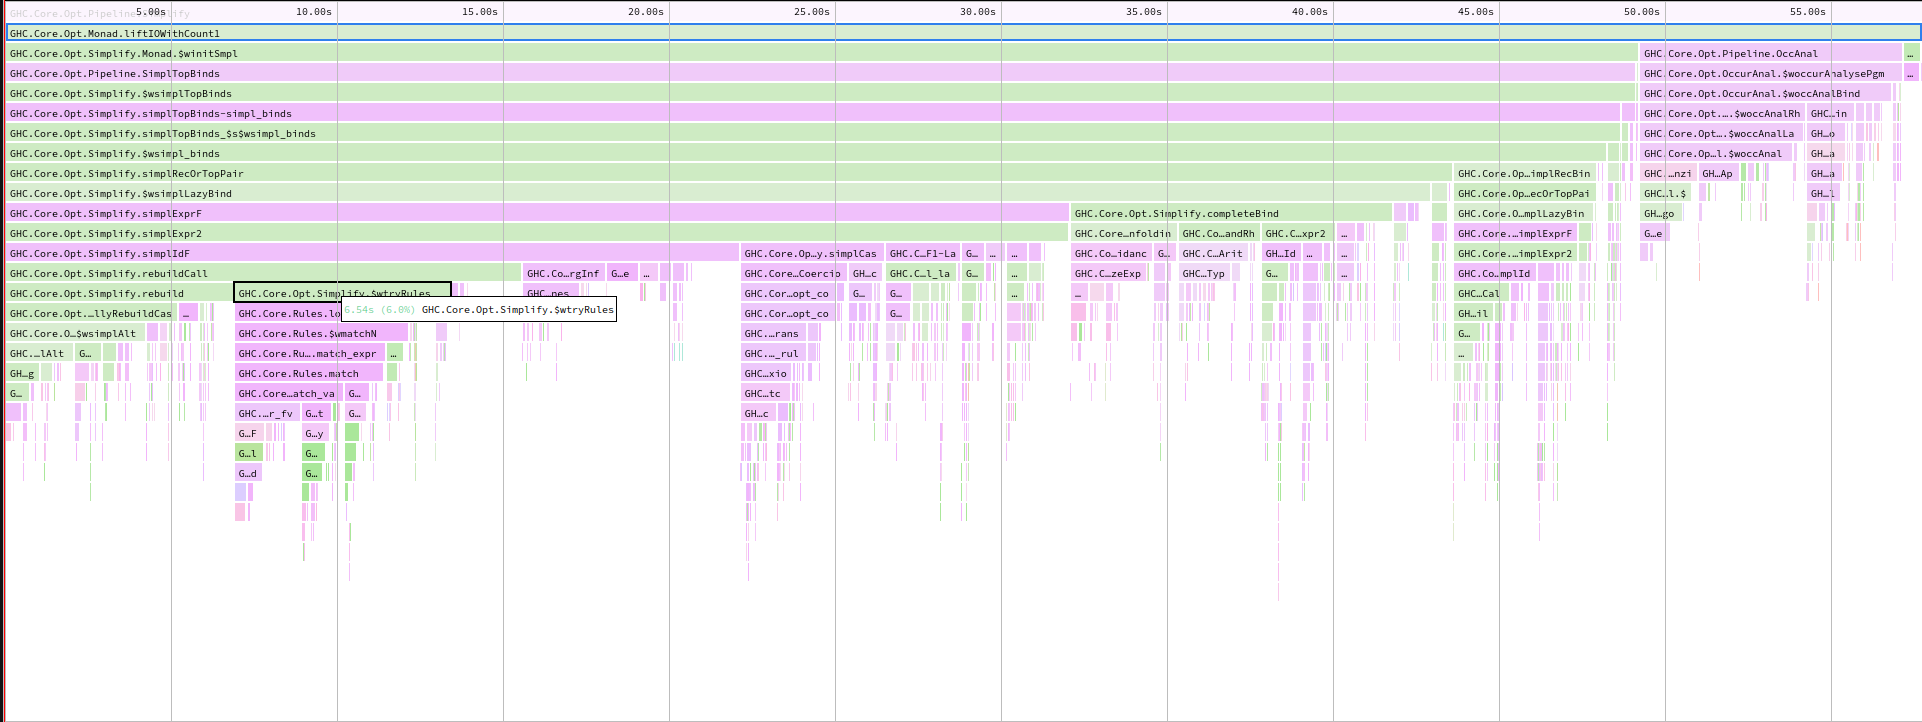
From this information, Andreas looked into this part of the code more deeply and identified one part of the rule-matching code which could be optimised. This resulted in !8608.
In addition to the obvious improvement in profile detail, having deeper cost centre stacks is useful
for exception provenance when using the -xc option, as well as improved
resolution of the whoCreated function.
Conclusion
The late cost centre feature adds a new dimension to time profiling of Haskell programs. The main benefits of late cost centre insertion are:
Profiled programs behave more like their unprofiled counterparts, as optimisation happens before insertion of cost centres. Thus the profile is less likely to produce skewed results that do not reflect normal behaviour.
We can have both a “big picture” and a detailed view about where time is spent. This is in contrast to existing methods of cost-centre insertion, which give either a relatively accurate view of the big picture (via a few manually inserted cost-centres) or a less accurate view of the details (via many automatically inserted cost-centres, which inhibit optimisation).
On the other hand, there are some small downsides to the approach:
- Functions that are completely inlined will not show up with late cost centre insertion. The cost will be attributed to the function the call was inlined into.
- The names of the cost centres are derived from GHC internal names, so it can be a little bit difficult to work out which part of your program the cost is attributed to. In order to resolve this, it’s sometimes necessary to look at the compiler intermediate representation.
- The level of detail can sometimes be a bit excessive. It would be nice if there was tooling that allowed removing certain cost centres from a profile, to make interpretation easier.
The feature is available natively in GHC 9.4 and later, but there is also a compiler plugin which can be used to emulate the feature with the 9.2 series.
This work has once again been made possible by Hasura, continuing our productive and long-running collaboration on tooling tasks that will ultimately benefit the entire ecosystem. Well-Typed is able to work on GHC, HLS, Cabal and other core Haskell infrastructure thanks to funding from various sponsors. If your company might be able to contribute to this work, sponsor maintenance efforts, or fund the implementation of other features, please read about how you can help or get in touch.