
ghc-debug is a debugging tool for performing precise heap analysis of Haskell programs
(check out our previous post introducing it).
While working on Eras Profiling, we took the opportunity to make some much
needed improvements and quality of life fixes to both the ghc-debug library and the
ghc-debug-brick terminal user interface.
To summarise,
ghc-debugnow works seamlessly with profiled executables.- The
ghc-debug-brickUI has been redesigned around a composable, filter based workflow. - Cost centers and other profiling metadata can now be inspected using both the library interface and the TUI.
- More analysis modes have been integrated into the terminal interface such as the 2-level profile.
This post explores the changes and the new possibilities for inspecting
the heap of Haskell processes that they enable. These changes are available
by using the 0.6.0.0 version of ghc-debug-stub and ghc-debug-brick.
Recap: using ghc-debug
There are typically two processes involved when using ghc-debug on a live program.
The first is the debuggee process, which is the process whose heap you want to inspect.
The debuggee process is linked against the ghc-debug-stub package. The ghc-debug-stub
package provides a wrapper function
withGhcDebug :: IO a -> IO athat you wrap around your main function to enable the use of ghc-debug. This wrapper
opens a unix socket and answers queries about the debuggee process’ heap, including
transmitting various metadata about the debuggee, like the ghc version it was compiled with,
and the actual bits that make up various objects on the heap.
The second is the debugger process, which queries the debuggee via the socket
mechanism and decodes the responses to reconstruct a view of the debuggee’s
Haskell heap. The most common debugger which people use is ghc-debug-brick, which
provides a TUI for interacting with the debuggee process.
It is an important principle of ghc-debug that the debugger and debuggee don’t
need to be compiled with the same version of GHC as each other. In other words,
a debugger compiled once is flexible to work with many different debuggees. With
our most recent changes debuggers now work seamlessly with profiled executables.
TUI improvements
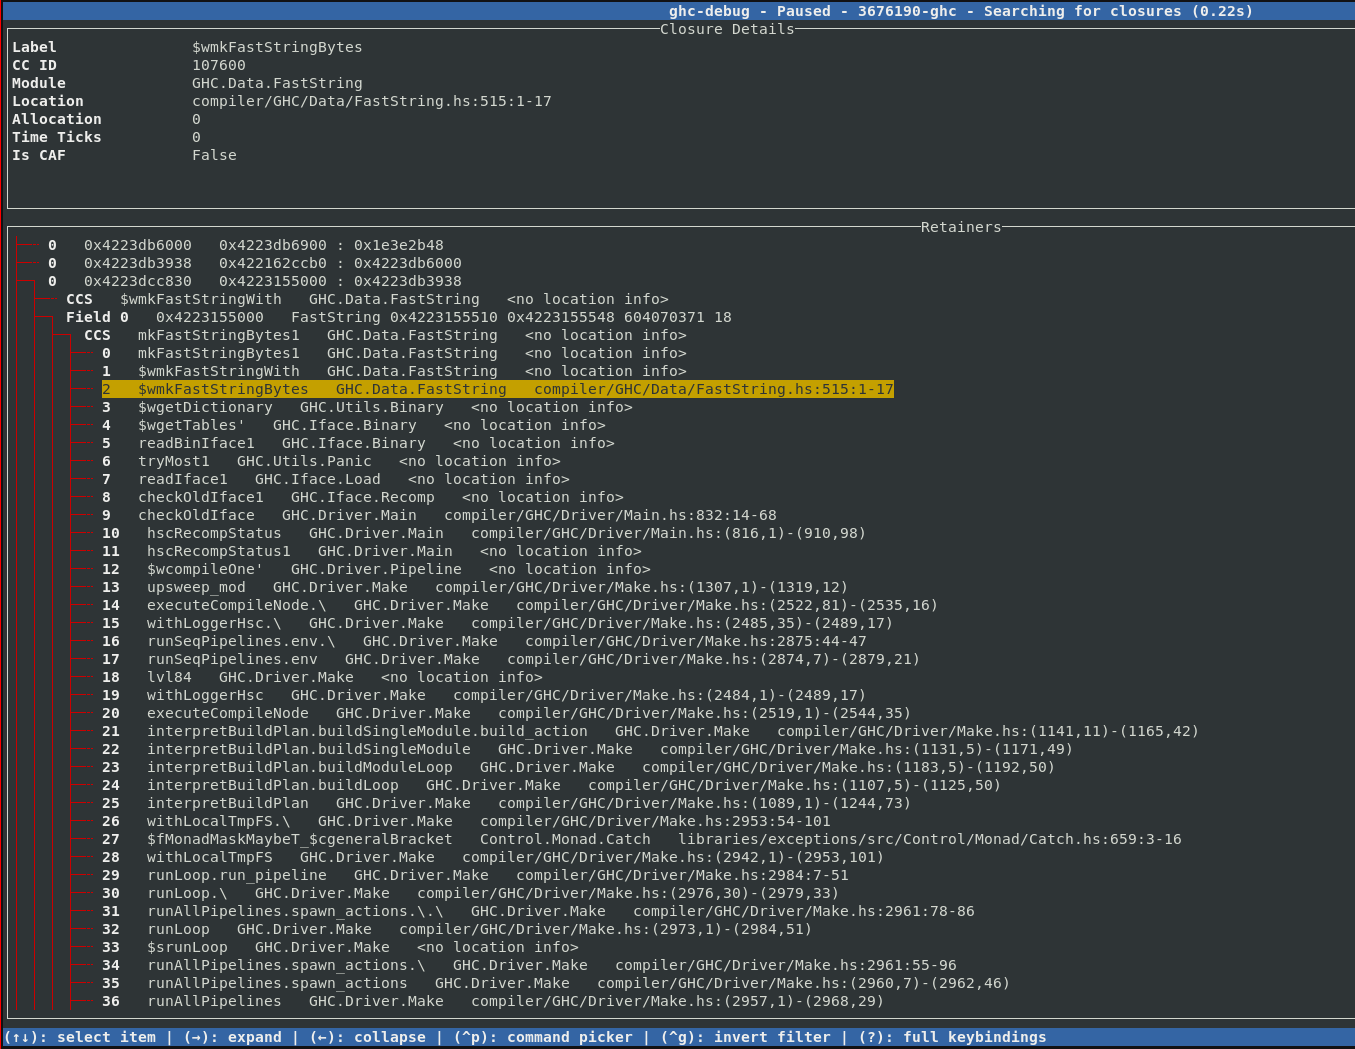
Exploring Cost Center Stacks in the TUI
For debugging profiled executables, we added support for decoding
profiling information in the ghc-debug library. Once decoding support was added, it’s easy to display the
associated cost center stack information for each closure in the TUI, allowing you to
interactively explore that chain of cost
centers with source locations that lead to a particular closure being allocated.
This gives you the same information as calling the GHC.Stack.whoCreated function
on a closure, but for every closure on the heap!
Additionally, ghc-debug-brick allows you to search for closures that have been
allocated under a specific cost center.
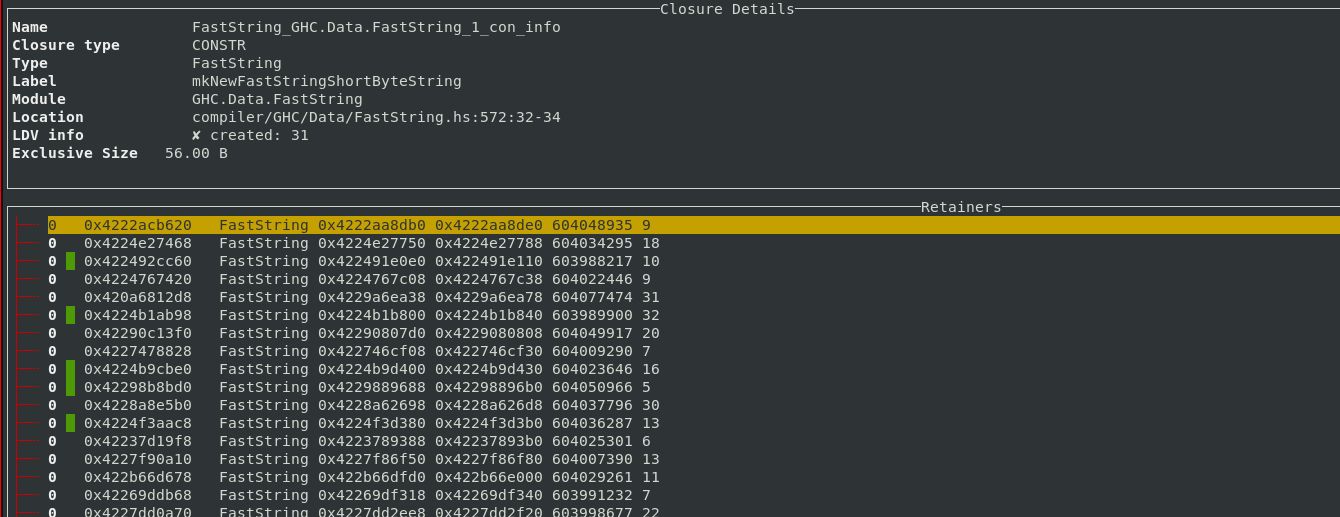
As we already discussed in the eras profiling blog post, object addresses are coloured according to the era they were allocated in.
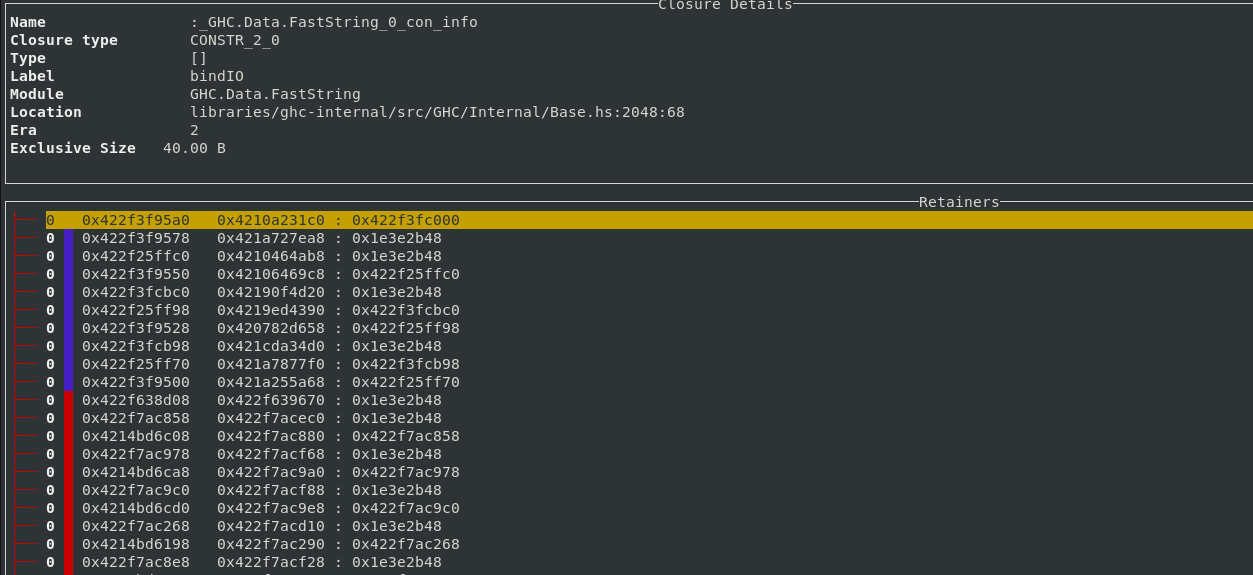
If other profiling modes like retainer profiling or biographical profiling are enabled, then the extra word tracked by those modes is used to mark used closures with a green line.
A filter based workflow
Typical ghc-debug-brick workflows would involve connecting to the client process
or a snapshot and then running queries like searches to track down the objects that
you are interested in. This took the form of various search commands available in the
UI:
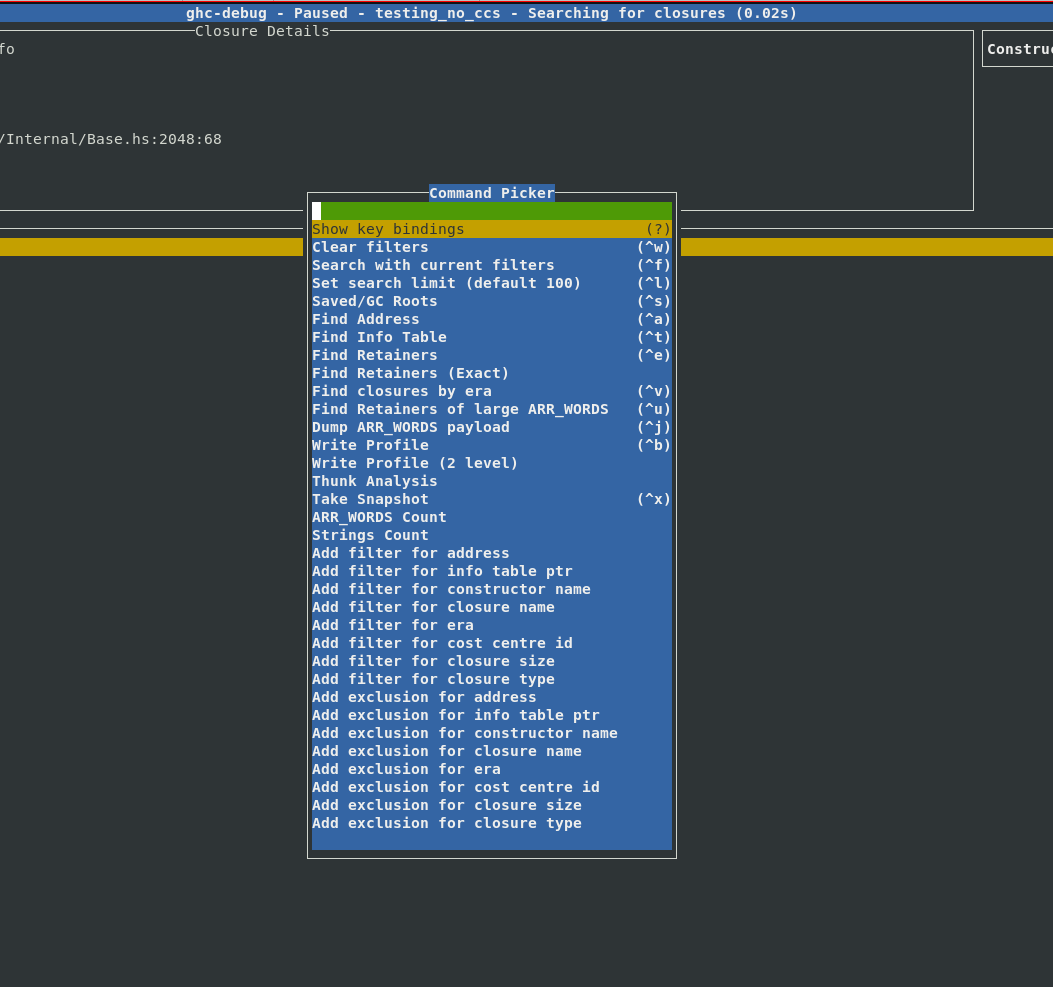
However, sometimes you would like to combine multiple search commands, in order to
more precisely narrow down the exact objects you are interested in. Earlier you
would have to do this by either writing custom queries with the ghc-debug Haskell
API or modify the ghc-debug-brick code itself to support your custom queries.
Filters provide a composable workflow in order to perform more advanced queries. You can select a filter to apply from a list of possible filters, like the constructor name, closure size, era etc. and add it to the current filter stack to make custom search queries. Each filter can also be inverted.
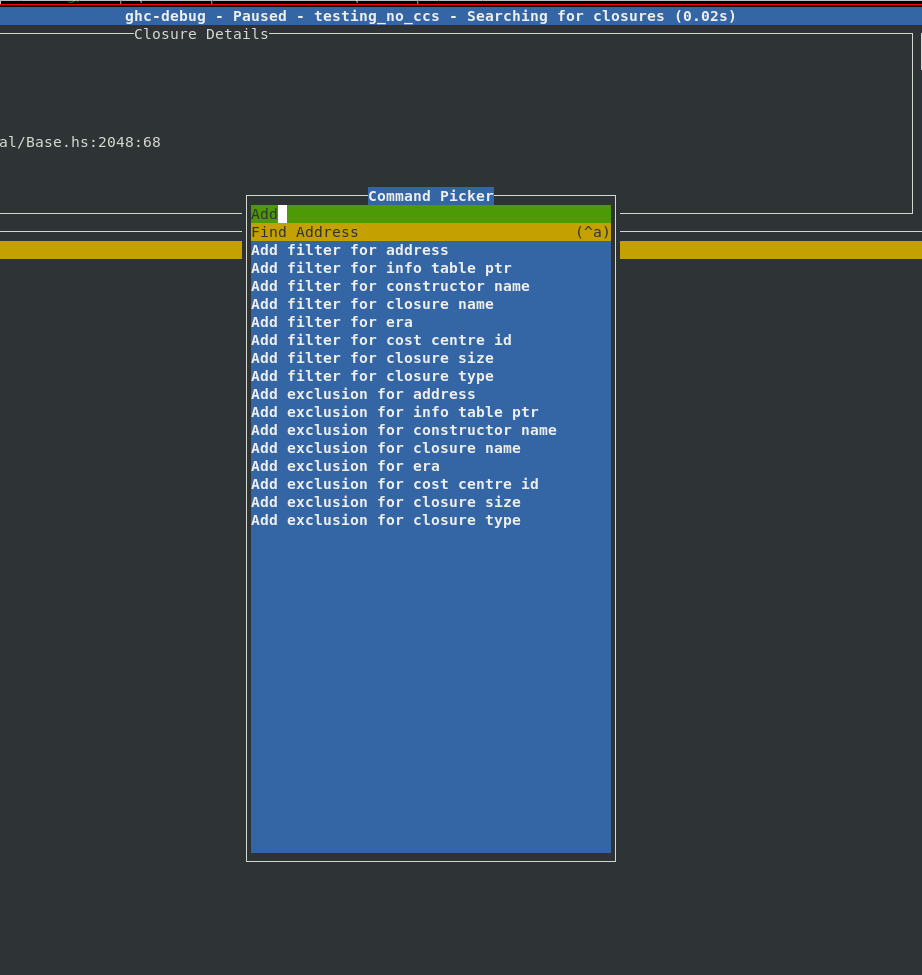
We were motivated to add this feature after implementing support for eras profiling as it was often useful to combine existing queries with a filter by era. With these filters it’s easy to express your own domain specific queries, for example:
- Find the
Fooconstructors which were allocated in a certain era. - Find all
ARR_WORDSclosures which are bigger than 1000 bytes. - Show me everything retained in this era, apart from
ARR_WORDSandGREconstructors.
Here is a complete list of filters which are currently available:
| Name | Input | Example | Action |
|---|---|---|---|
| Address | Closure Address | 0x421c3d93c0 | Find the closure with the specific address |
| Info Table | Info table address | 0x1664ad70 | Find all closures with the specific info table |
| Constructor Name | Constructor name | Bin | Find all closures with the given constructor name |
| Closure Name | Name of closure | sat_sHuJ_info | Find all closures with the specific closure name |
| Era | <era>/<start-era>-<end-era> | 13 or 9-12 | Find all closures allocated in the given era range |
| Cost centre ID | A cost centre ID | 107600 | Finds all closures allocated (directly or indirectly) under this cost centre ID |
| Closure Size | Int | 1000 | Find all closures larger than a certain size |
| Closure Type | A closure type description | ARR_WORDS | Find all ARR_WORDS closures |
All these queries are retainer queries which will not only show you the closures in question but also the retainer stack which explains why they are retained.
Improvements to profiling commands
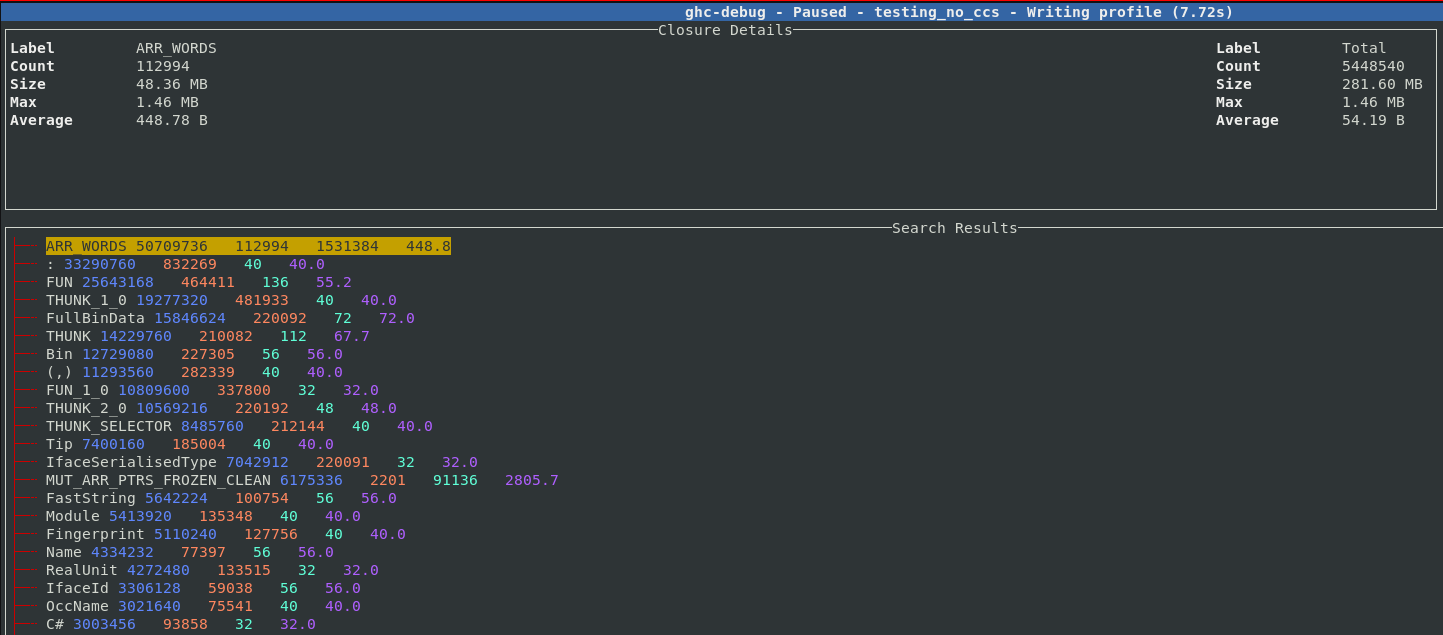
ghc-debug-brick has long provided a profile command which performs a heap
traversal and provides a summary like a single sample from a -hT profile.
The result of this query is now displayed interactively in the terminal interface.
For each entry, the left column in the header shows the type of closure in
question, the total number of this closure type which are allocated,
the number of bytes on the heap taken up by this closure, the maximum size of each of
these closures and the average size of each allocated closure.
The right column shows the same statistics, but taken over all closures in the
current heap sample.
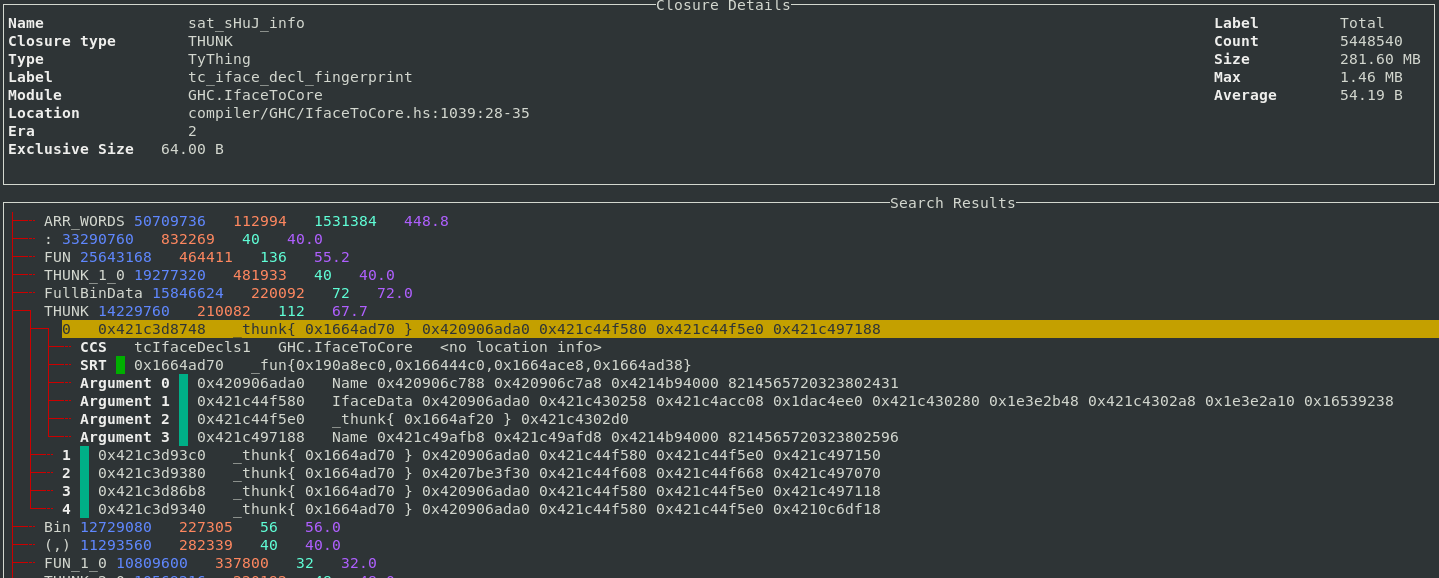
Each entry can be expanded, five sample points from each band are saved so you can inspect some closures which contributed to the size of the band. For example, here we expand the THUNK closure and can see a sample of 5 thunks which contribute to the 210,000 thunks which are live on this heap.
Support for the 2-level closure type profile has also been added to the TUI.
The 2-level profile is more fine-grained than the 1-level profile as the profile
key also contains the pointer arguments for the closure rather than just the
closure itself. The key :[(,), :] means the list cons constructor, where the head argument
is a 2-tuple, and the tail argument is another list cons.
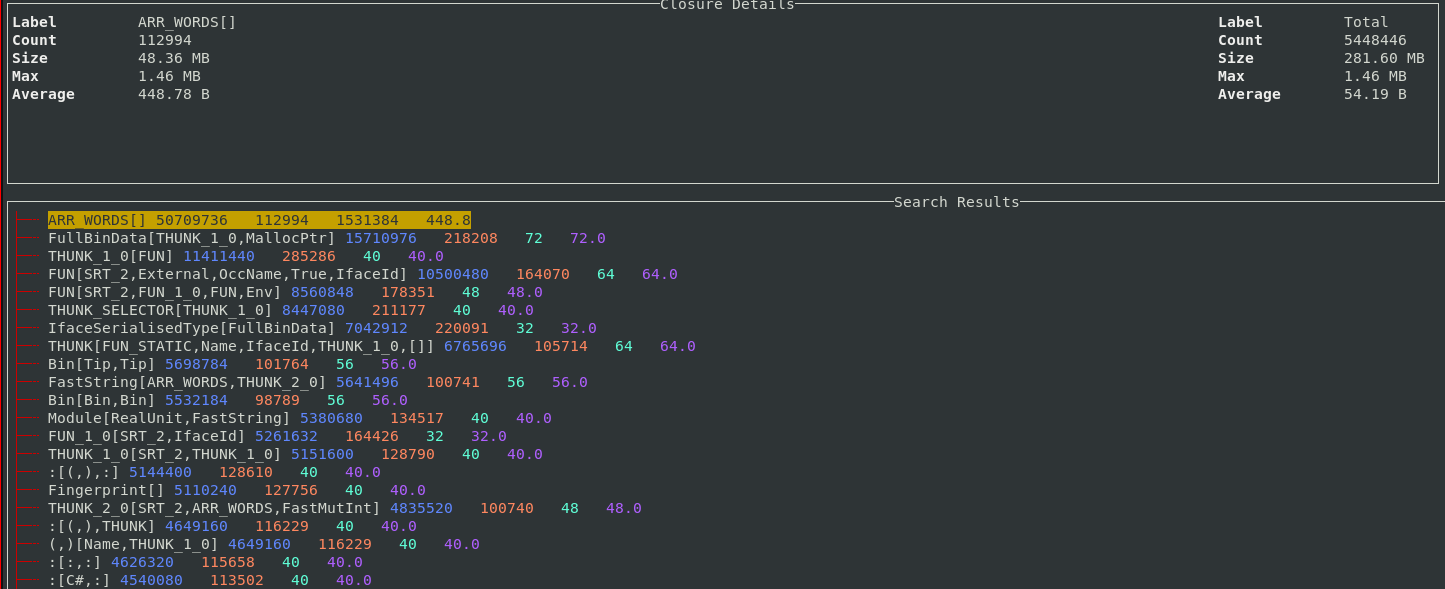
For example, in the 2-level profile, lists of different types will appear as different bands. In the profile above you can see 4 different bands resulting from lists, of 4 different types. Thunks also normally appear separately as they are also segmented based on their different arguments. The sample feature also works for the 2-level profile so it’s straightforward to understand what exactly each band corresponds to in your program.
Other UI improvements
In addition to the new features discussed above, some other recent enhancements include:
- Improved the performance of the main view when displaying a large number of rows. This noticeably reduces input lag while scrolling.
- The search limit was hard-coded to 100 objects, which meant that only the first few results of a search would be visible in the UI. This limit is now configurable in the UI.
- Additional analyses are now available in the TUI, such as finding duplicate
ARR_WORDSclosures, which is useful for identifying cases where programs end up storing many copies of the same bytestring.
Conclusion
We hope that the improvements to ghc-debug and ghc-debug-brick will aid the
workflows of anyone looking to perform detailed inspections of the heap of their
Haskell processes.
This work has been performed in collaboration with Mercury. Mercury have a long-term commitment to the scalability and robustness of the Haskell ecosystem and are supporting the development of memory profiling tools to aid with these goals.
Well-Typed are always interested in projects and looking for funding to improve GHC and other Haskell tools. Please contact info@well-typed.com if we might be able to work with you!