
Haddock is the documentation generation tool for Haskell. Given a set of Haskell modules, Haddock can generate documentation for those modules in various formats based on specially formatted comments in the source code. Haddock is a very important part of the Haskell ecosystem, as many authors and users of Haskell software rely on Haddock-generated documentation to familiarize themselves with the code.
Recently, Mercury asked us to investigate performance problems in Haddock that were preventing their developers from using it effectively. In particular, when running on Mercury’s code, Haddock would eat up all of the memory on 64GB machines. This made it difficult for their developers to generate documentation to browse locally.
At a high level, the work covered by this post has resulted in Haddock’s memory usage being roughly halved. The full set of Haddock and GHC changes resulting in these improvements will be shipped with GHC 9.8.
All this profiling and debugging work was completed using the
eventlog2html and ghc-debug tools, which are
excellent for characterising and diagnosing Haskell program performance.
However, these are much less widely known than they deserve to be. This post
aims to act as a case study demonstrating how we have used the tools to make
significant performance improvements to a complex, real-world application.
If you’re interested in finding out more about these tools, read on or check out some of our videos:
Characterising the problem
The first step towards diagnosing Haddock’s memory behavior is generating a
memory profile with eventlog2html.
An eventlog is a file that can be generated by the GHC runtime
system when a Haskell program is executed, containing lots of information about
the execution that is useful for profiling. When the program is run with heap
profiling enabled, it will regularly emit heap usage samples to the eventlog.
Subsequently, eventlog2html can be used to convert this file into an HTML
document with interactive visualisations and statistics of the program’s memory
profile. Exploring a profile generated by eventlog2html often leads to
discovery of optimization opportunities that are otherwise difficult to find.
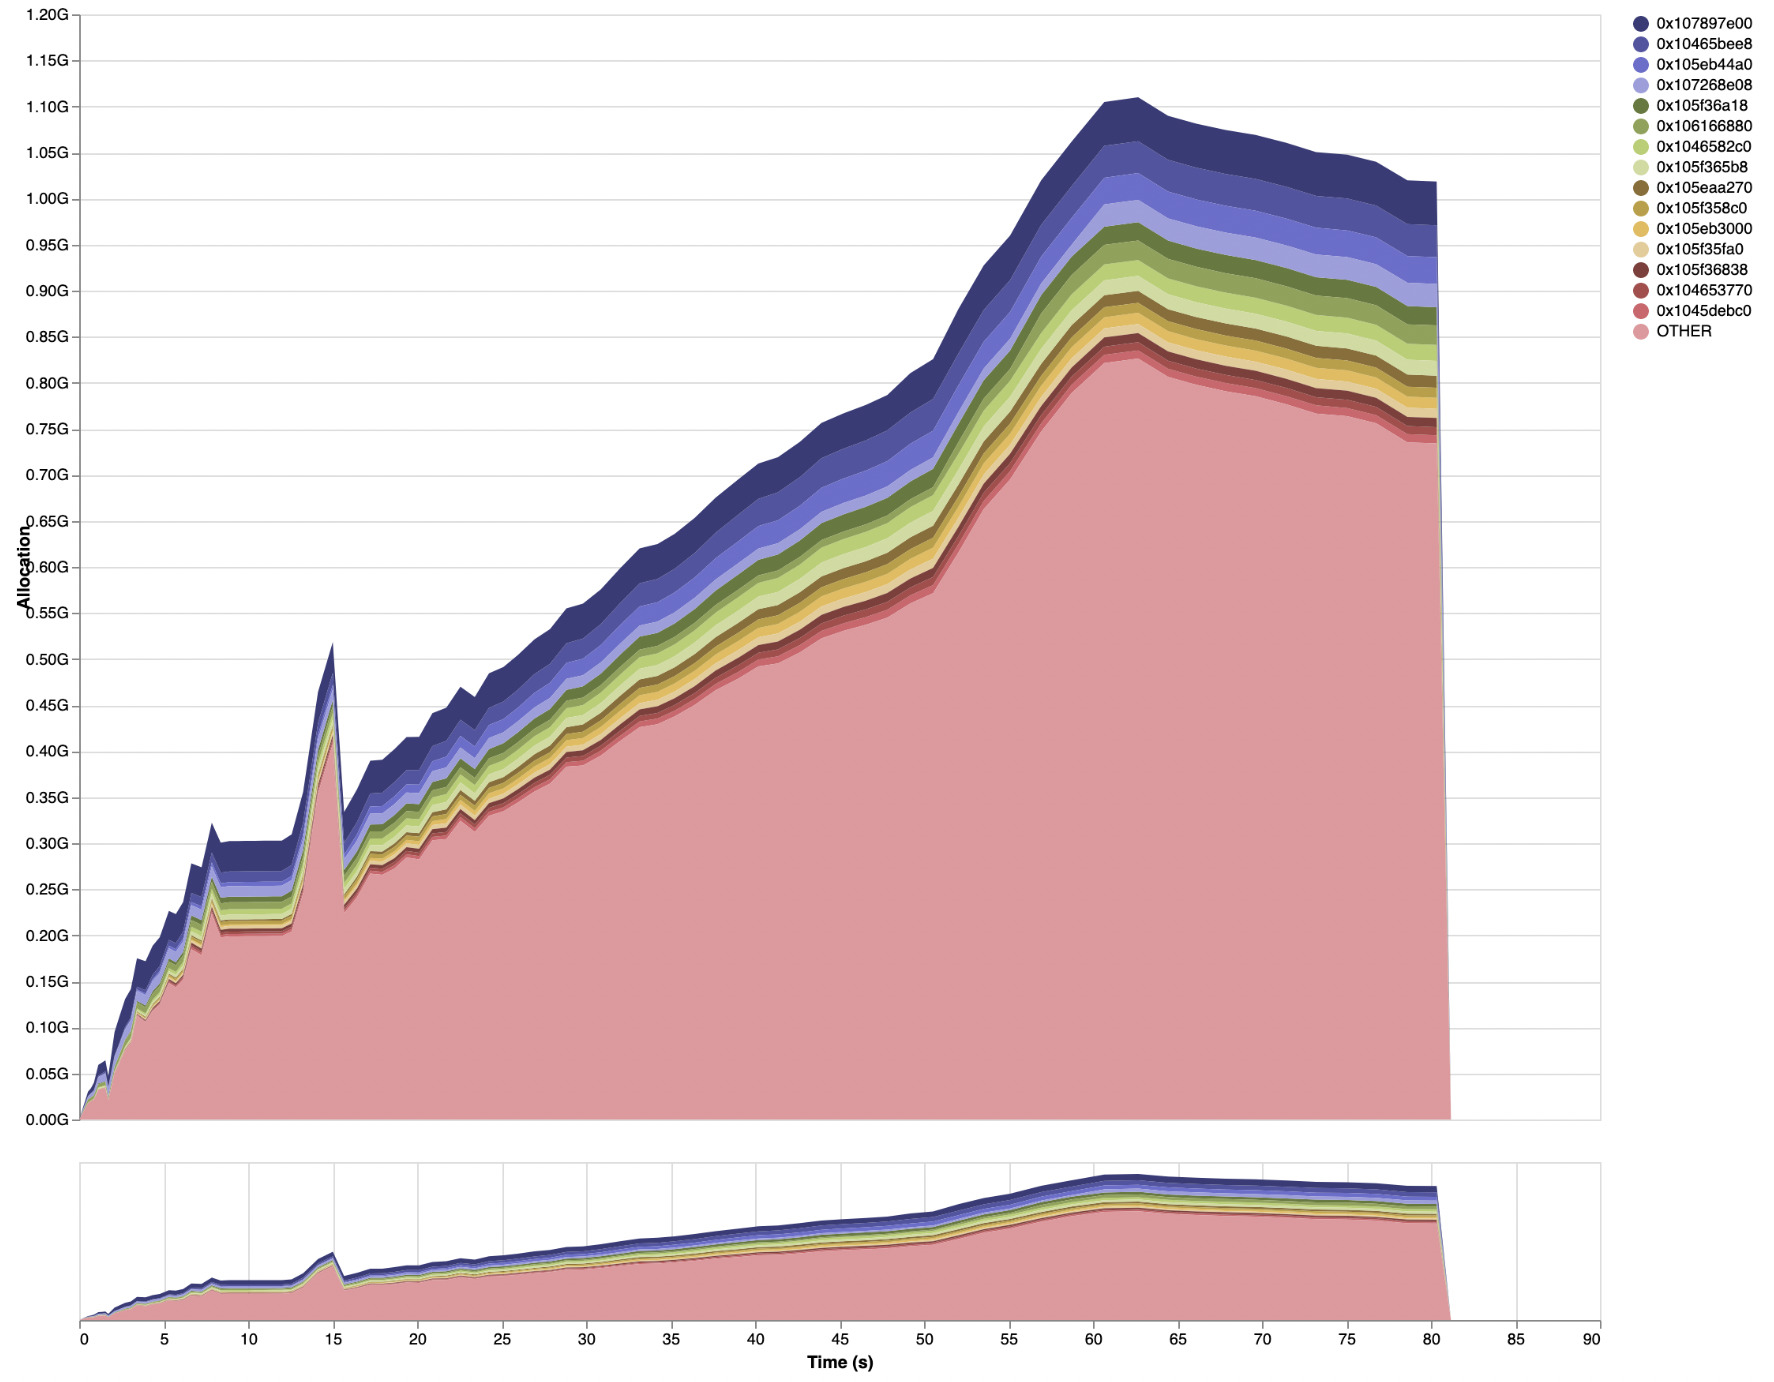
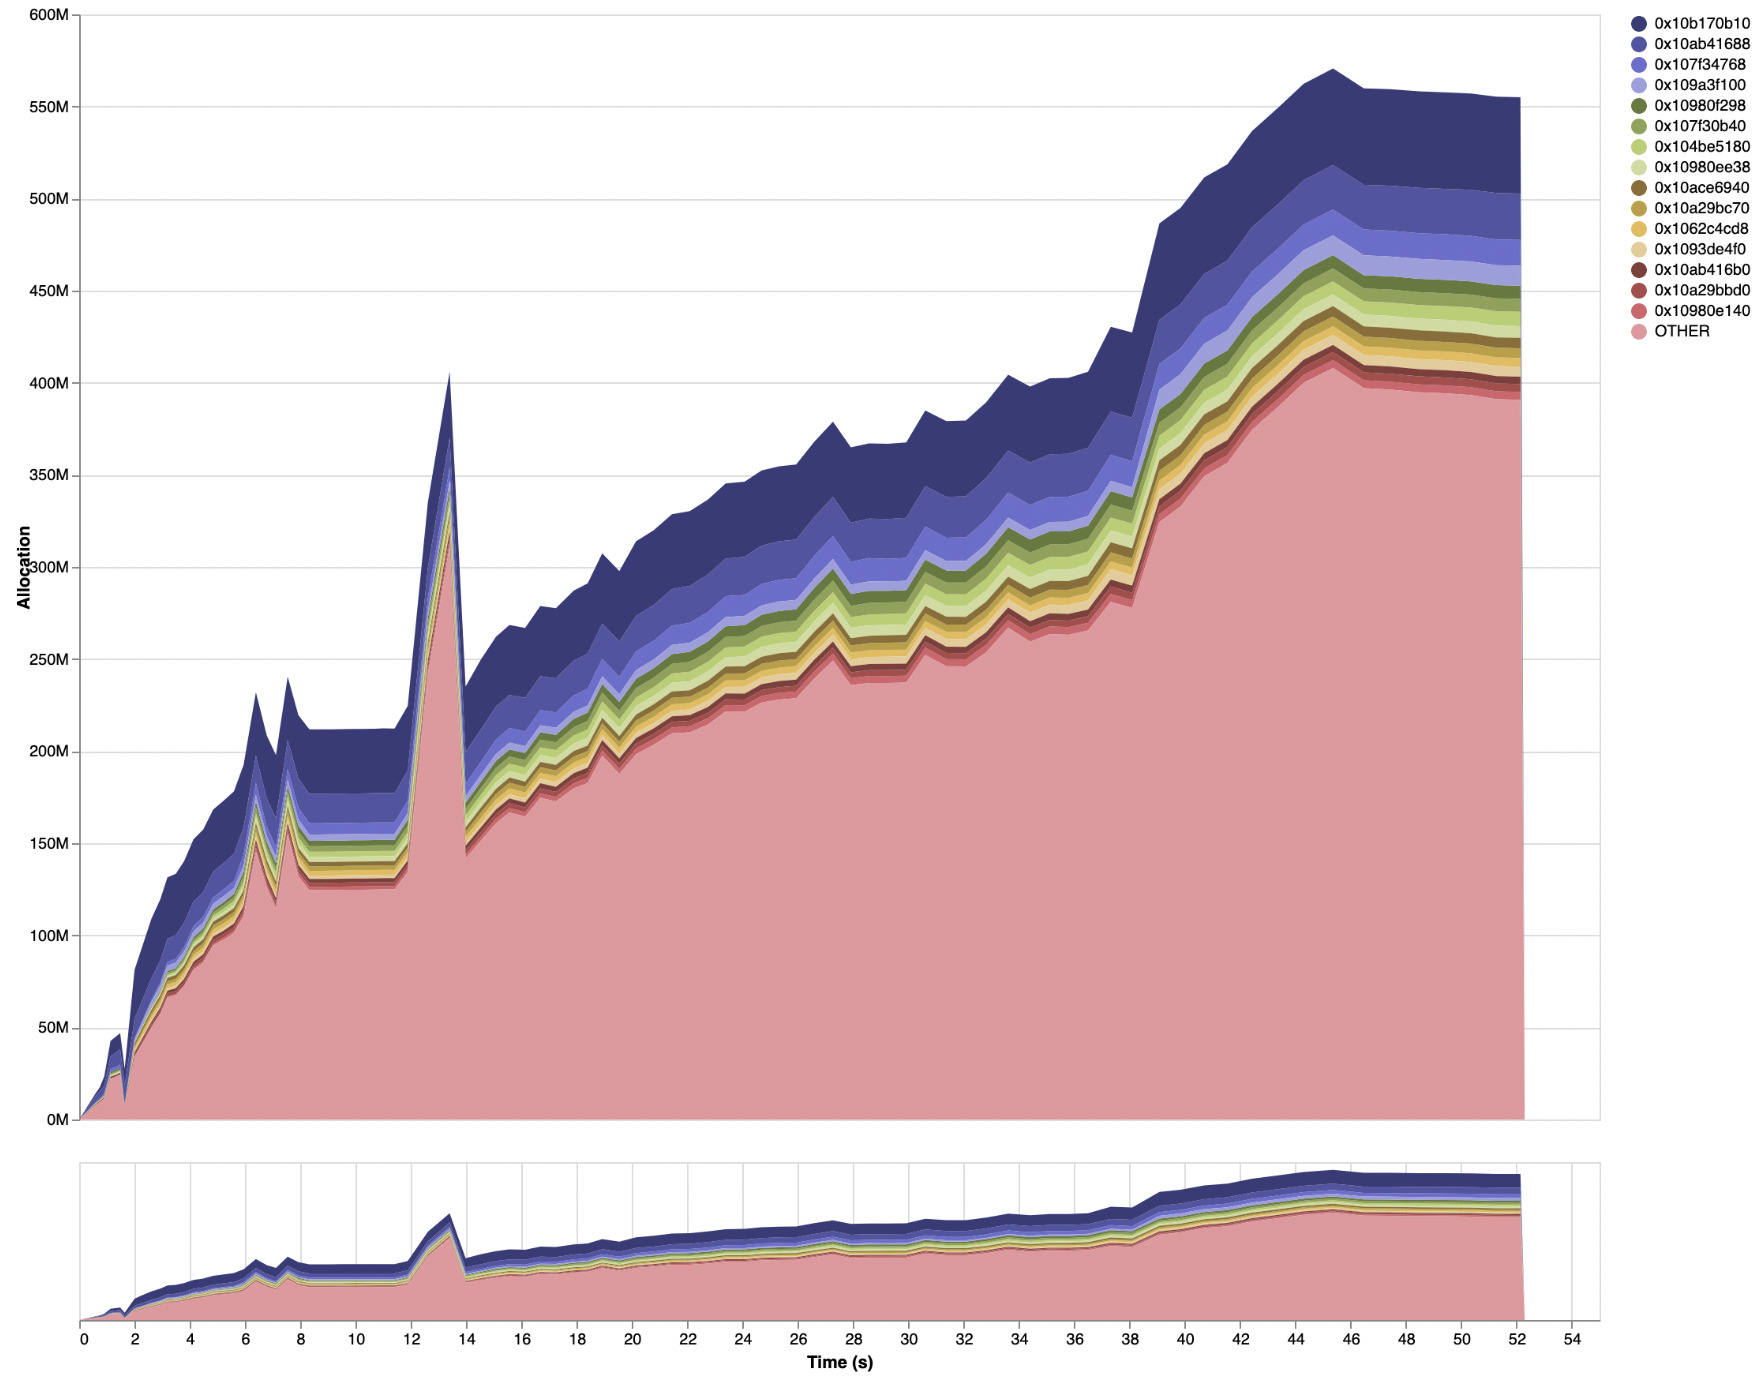
The following baseline profile shows live heap data over time used by Haddock to generate HTML documentation on the Agda codebase:1
You can also see the full HTML page generated by eventlog2html for the baseline,
and later profiles are also accompanied by links to the HTML version.
Note: Chrome may fail to render the “Detailed” tab of the profiles (see eventlog2html issue 166). Firefox is recommended.
This shows that the memory usage increases through the run until it reaches a
peak with a 1.1GB of live data on the Haskell heap. Since this counts only live
data, the actual process memory usage will be much higher (e.g. the copying
garbage collector at least doubles the amount of memory needed). The “Heap” tab
of the eventlog2html output shows more detail: it includes “Live Bytes” (as in
the main profile) and “Heap Size” (the total memory used by the runtime system),
which in this example reaches 2.3GB.
Info table profiling
This profile was generated using info table profiling, a new profiling method
that avoids the need for recompiling the application in profiling mode and
provides extra detail. You can
read more about info table profiling
in our previous post.
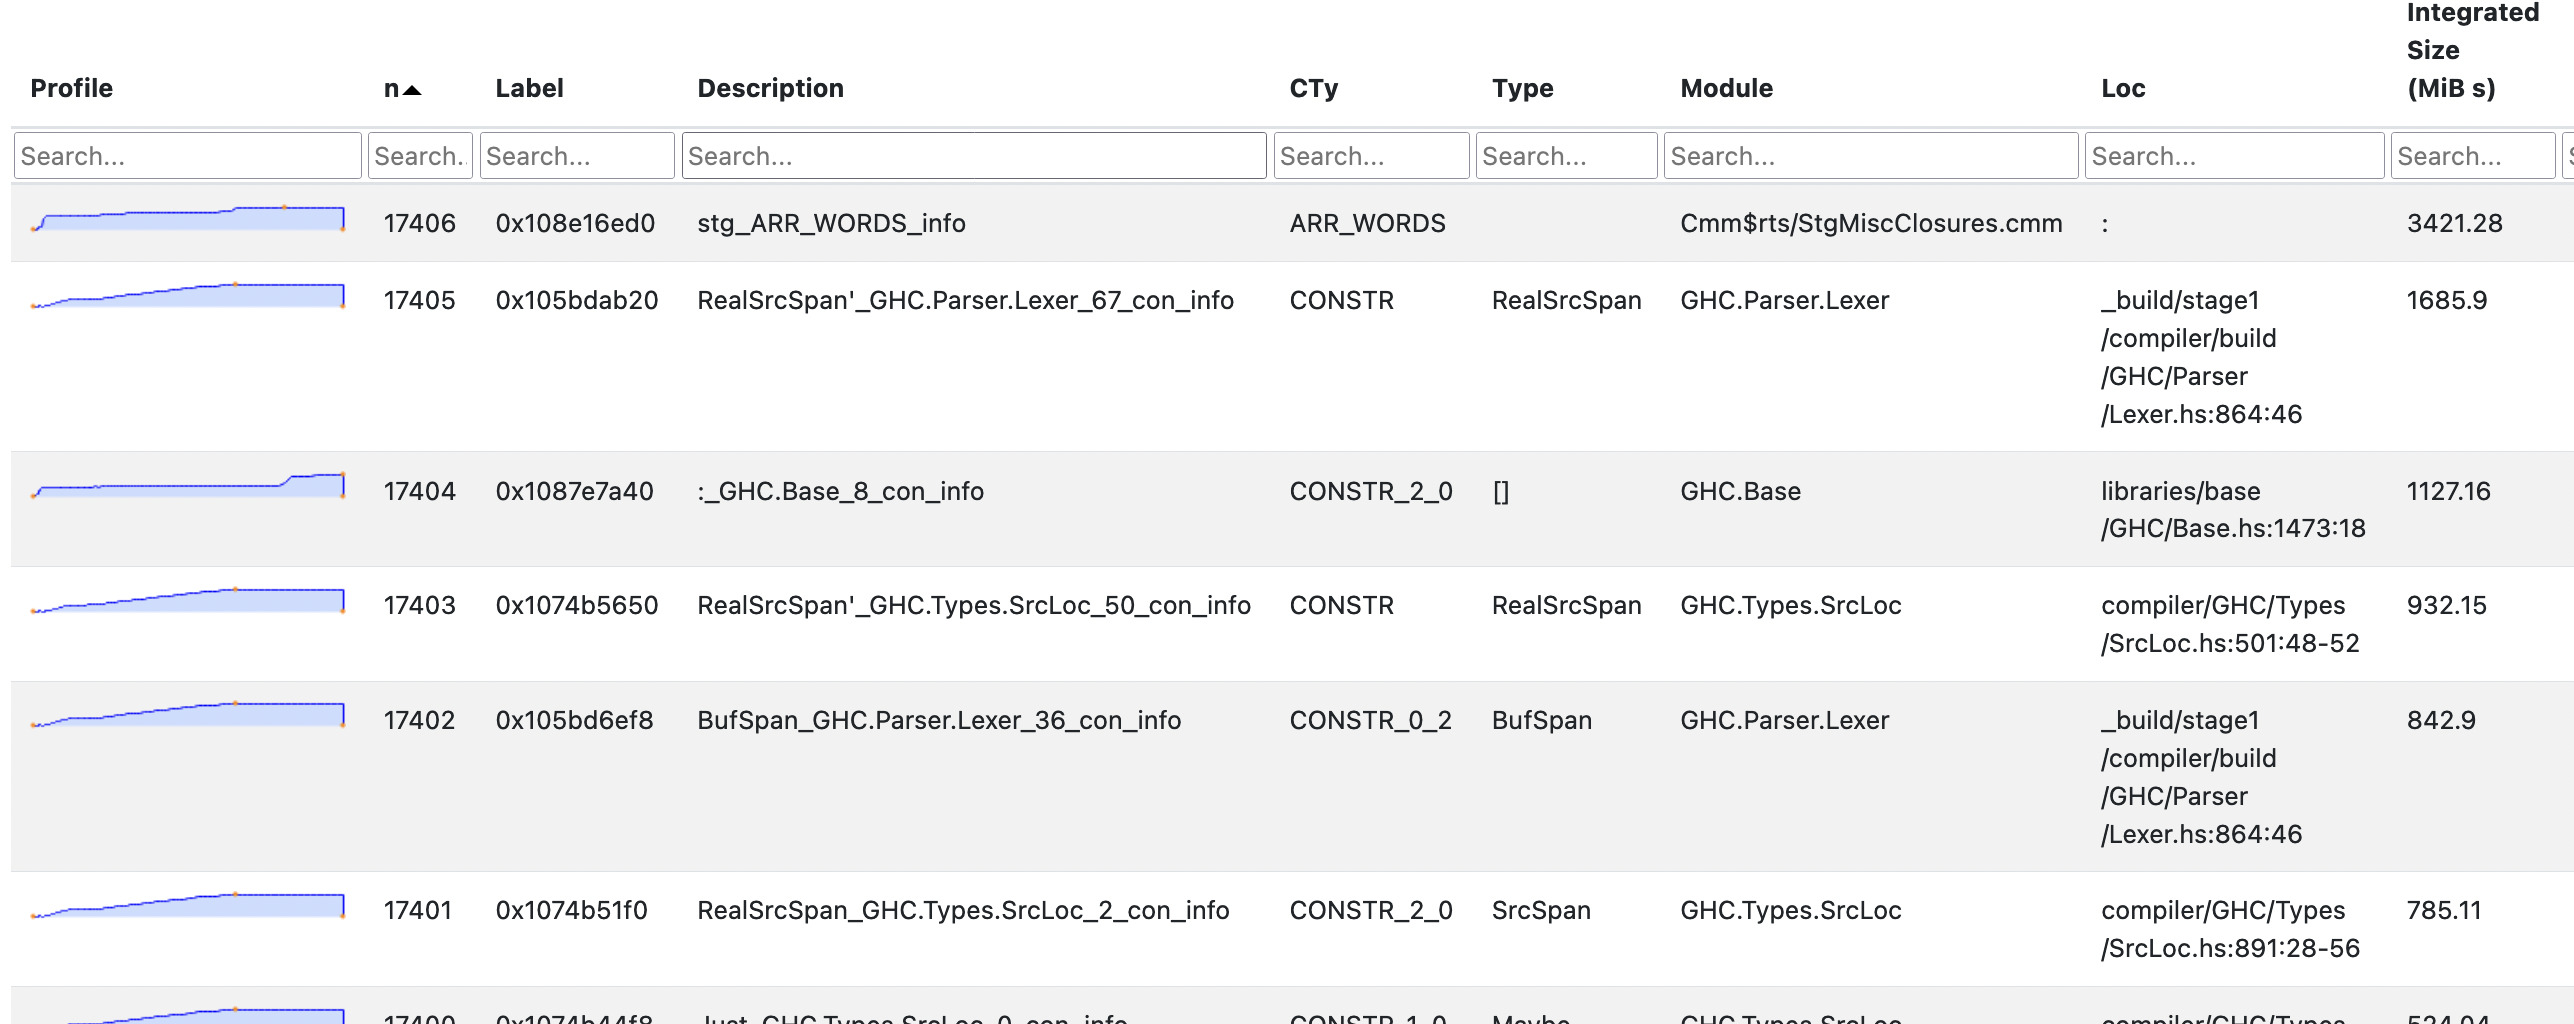
This means the eventlog2html “Detailed” tab is also very revealing
(full HTML page here):
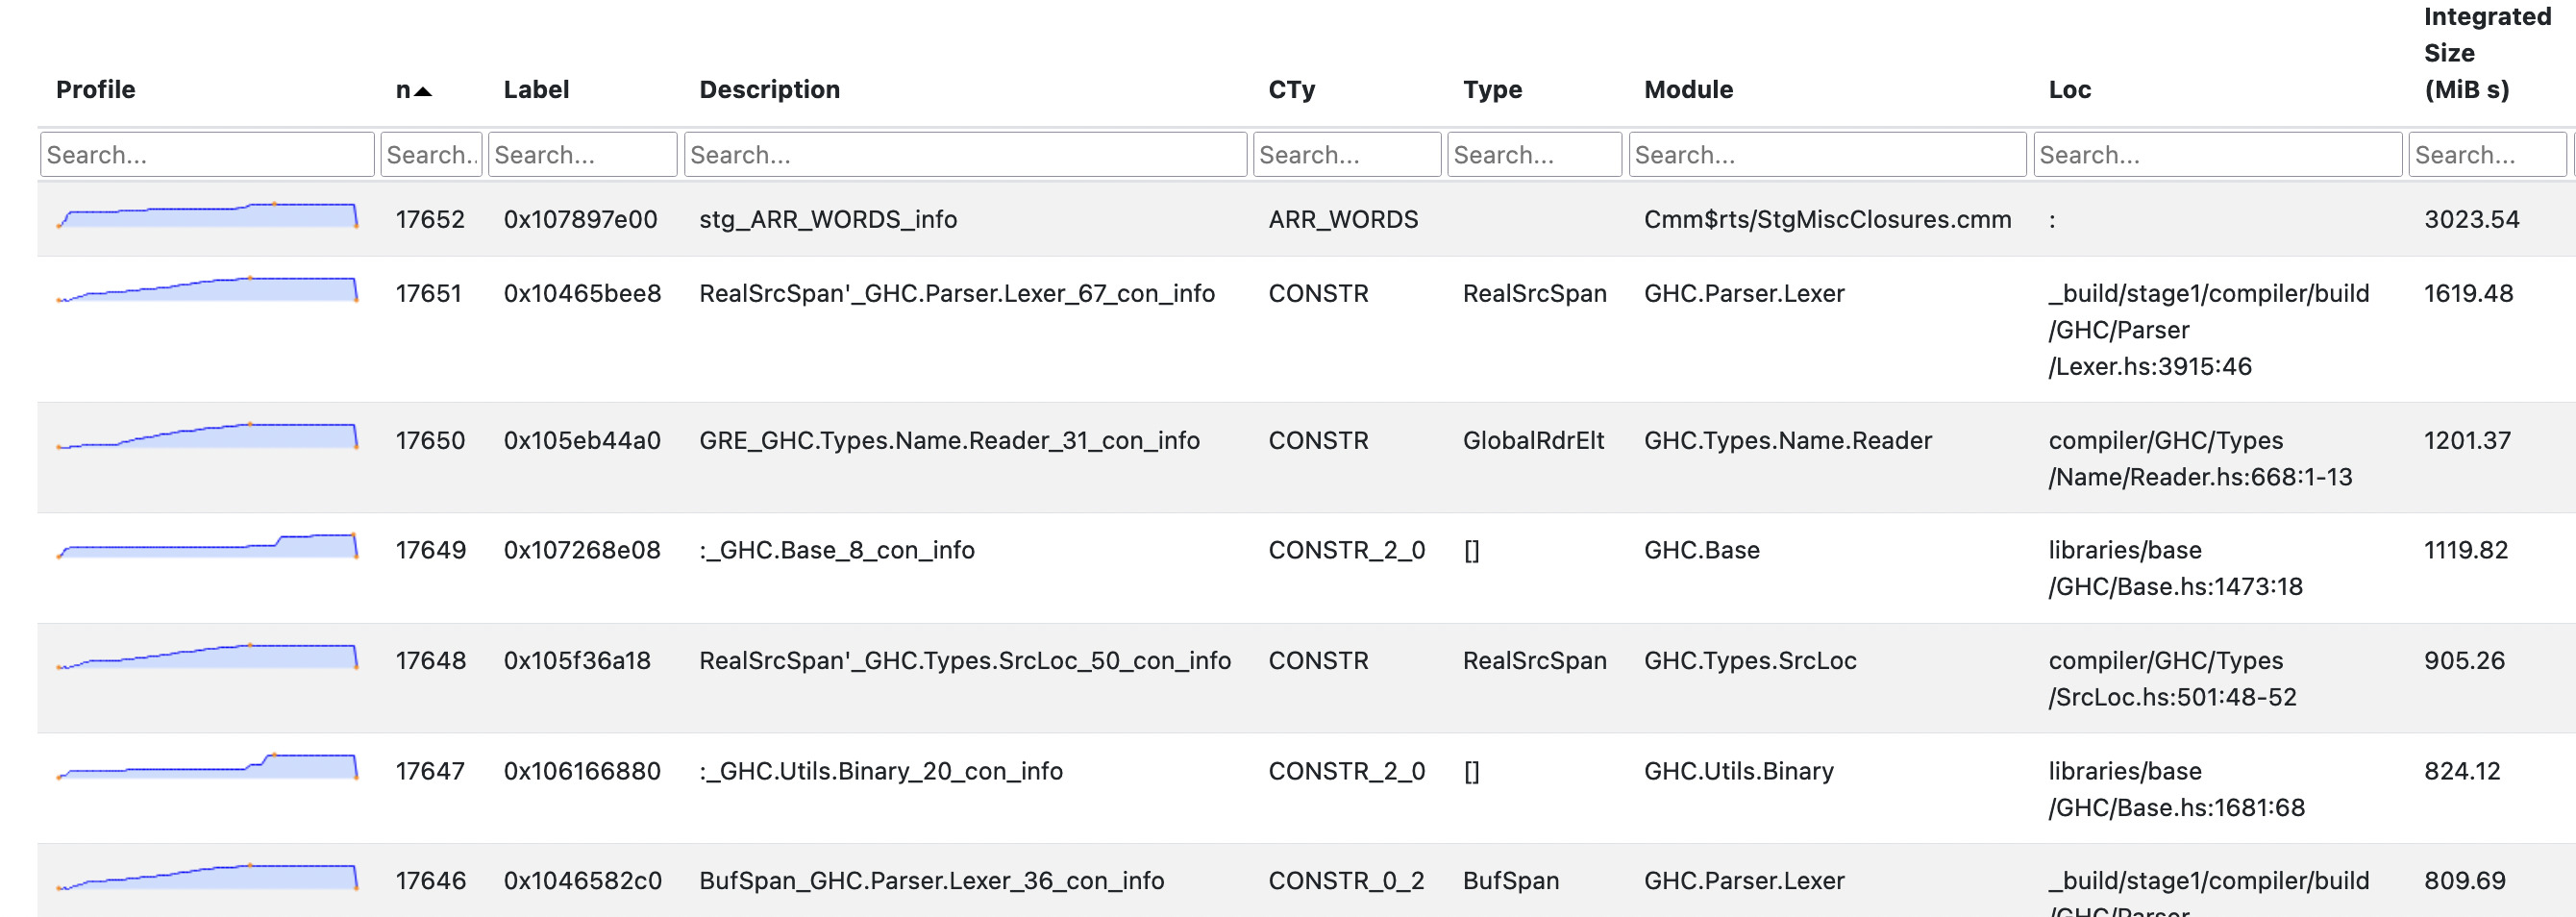
An info table roughly corresponds to an allocation site (such as a thunk or data constructor application) in the source code. For each info table, we see a sparkline profile of the heap usage over time, plus type information and a source location showing the code responsible for the allocation. This allows us to explore the sources of excessive allocations in more detail.
Any source module provided to Haddock is first type-checked using the GHC API.
Thus we need to carefully distinguish what parts of
the profile are coming from GHC and not Haddock itself. Digging around in the details revealed that the
visible spike in memory usage at the start of the profile is coming from the GHC
typechecker. This can be seen by finding the
closures (heap objects) that contribute to that spike, the majority of which are list closures
allocated in the GHC.Tc.Utils.Zonk module (which is only used for type
checking).
Finding retainers using ghc-debug
The third row of the table shows that much of the heap is occupied by occurrences of the
GRE constructor of the GlobalRdrElt type. These values represent the “global renaming
environment”, used to track things
that are in-scope during name resolution.2
Knowing how Haddock operates, there is no good reason these closures should be
sticking around on the heap throughout the entire run. Rather, once a module has been
processed by Haddock, scope information for that module should no longer be retained in memory.
To figure out why these closures are building up on the heap, we can use
ghc-debug’s retainer profiling capabilities. ghc-debug is a tool
to interactively or programmatically inspect the heap of a Haskell process by
pausing it and attaching a debugger process.
To find out more, you can check out our previous post on using ghc-debug to analyse memory fragmentation.
After instrumenting Haddock with ghc-debug we can connect to the
process using
ghc-debug-brick, which
provides a terminal UI for interactively exploring and running queries over the
heap. In particular, it can search for retainers of GRE closures,
which results in retainer paths like the following:
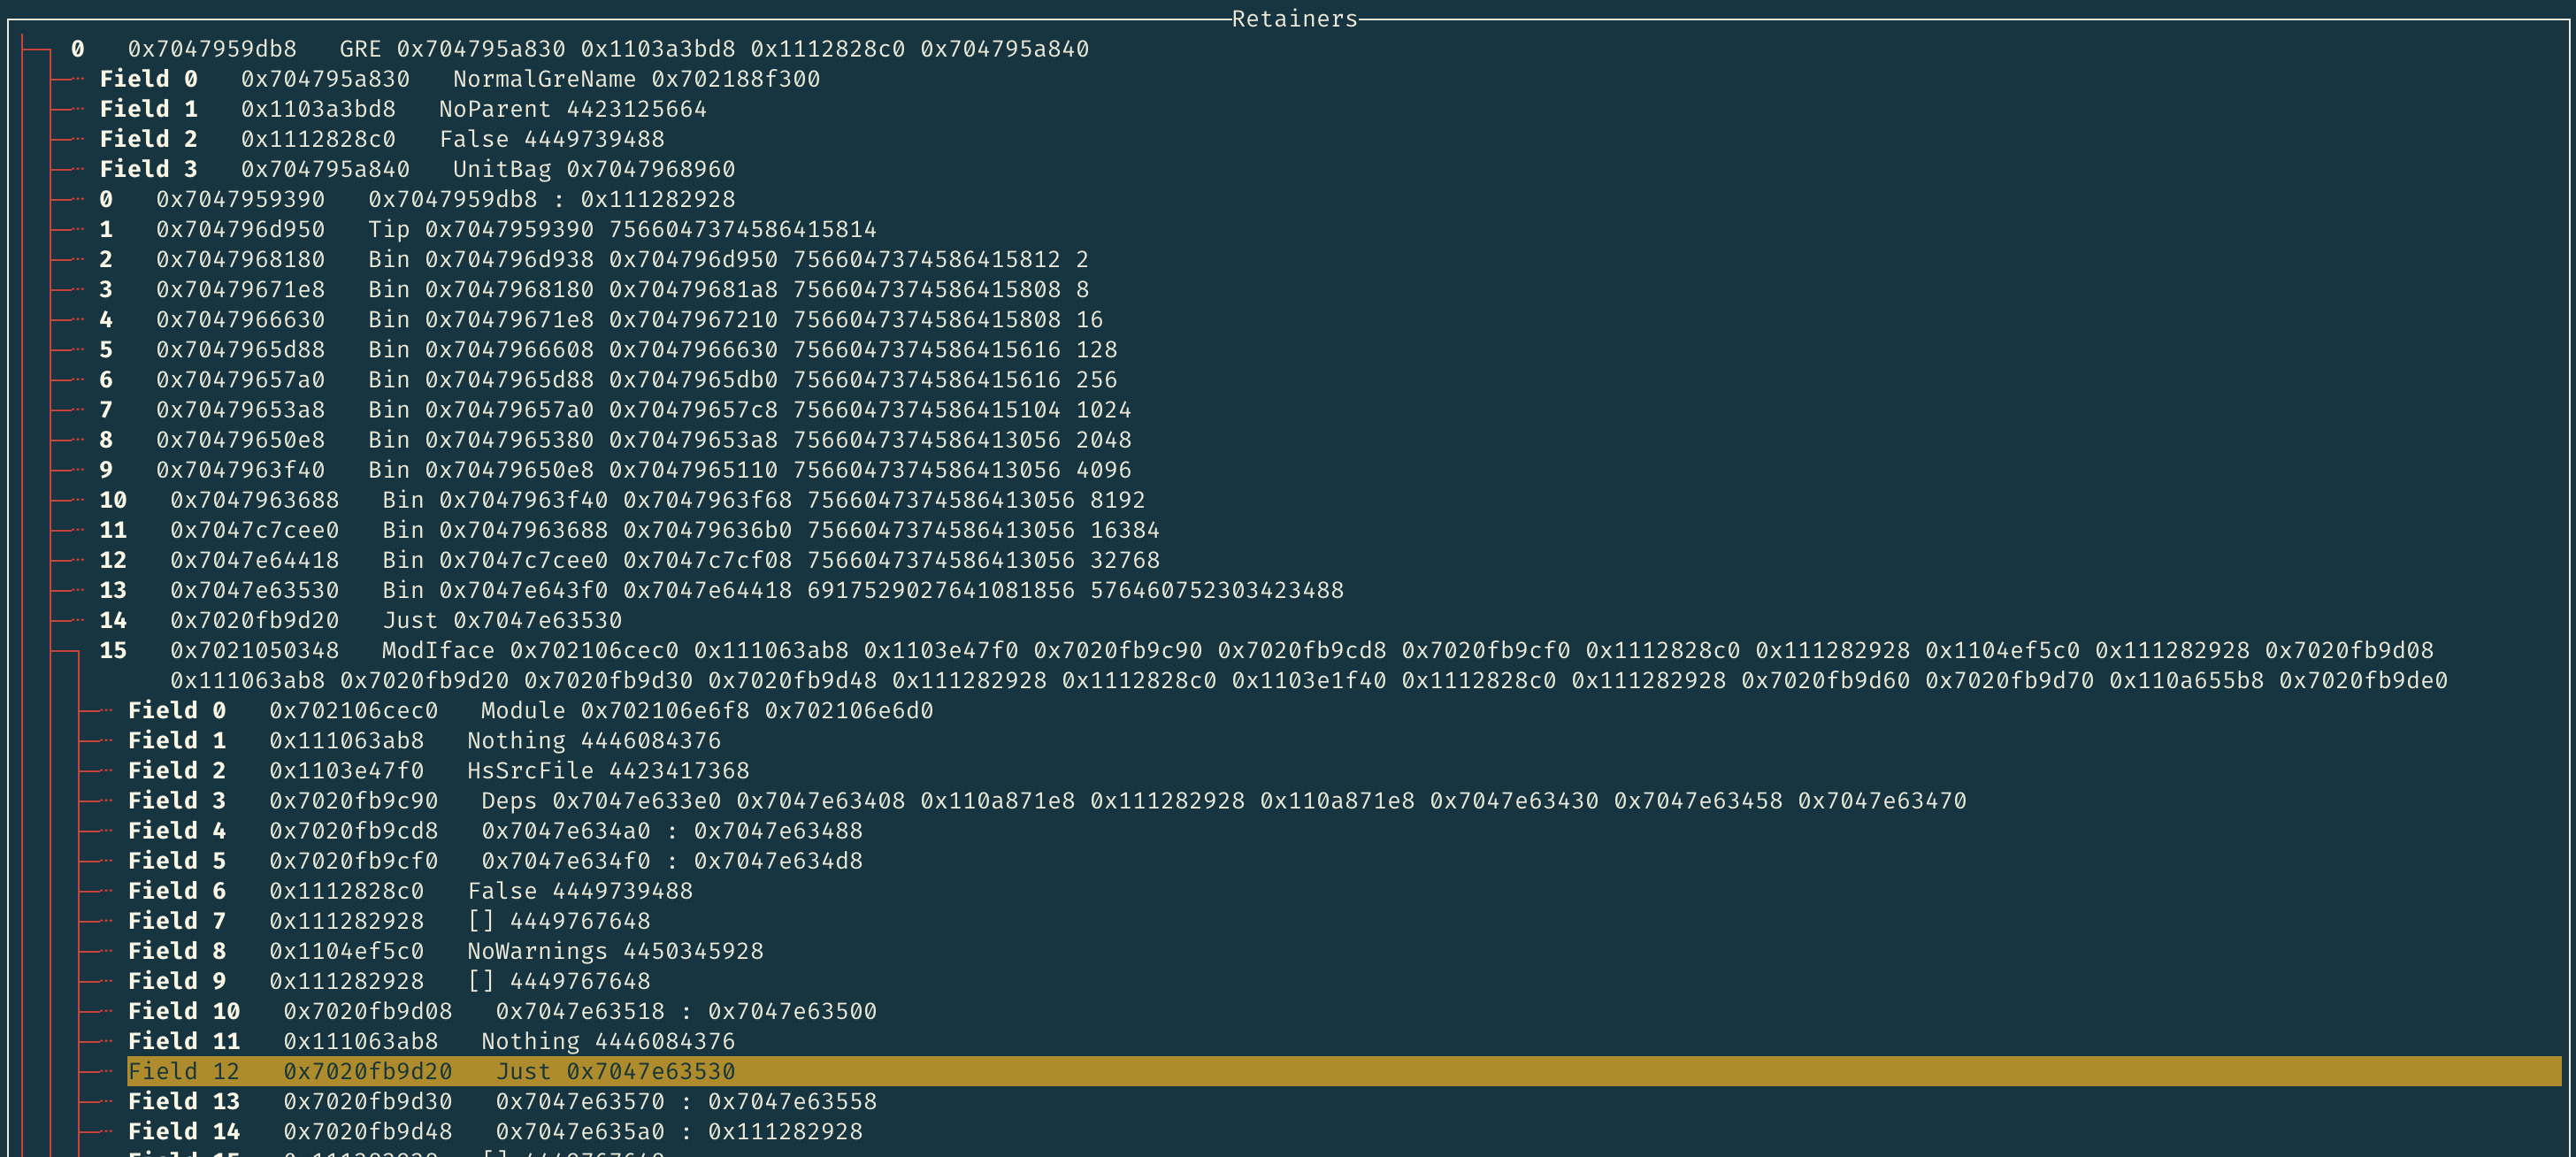
The GRE closure we are examining is shown at the very top. The items
beneath it labeled as fields are closures that this GRE closure is retaining (keeping references to).
The retainer path of the GRE closure is displayed
beneath the fields. Each closure shown in the path is directly referenced by the
closure beneath it (though these paths are not necessarily unique, so it may be referenced elsewhere as well).
In this case, we see from retainer number 15 that the
GRE closure is transitively retained by a ModIface closure, which we have expanded to show its fields.
By comparing closure addresses, we see that the reference is in field 12,
namely the mi_globals field of the ModIface constructor.
While it requires some knowledge of the workings of the Haskell heap and the
expected memory behaviour of the program, ghc-debug makes it
possible to track down issues very precisely.
Fixing the problem
As
the documentation for the mi_globals
field
indicates, it is really used only by GHCi.
However, it was also enabled for GHC’s “no-code” backend at some point, which is
what Haddock uses.
It turns out we can set this field to Nothing for GHC’s no-code backend and
reduce Haddock’s memory usage by about 20% without any negative side effects.
See !10469 for the patch.
With just this change in GHC and no changes to
Haddock, the peak live data residency for Haddock on the Agda codebase is now down below 950MB,
with the following profile (full eventlog2html output here):
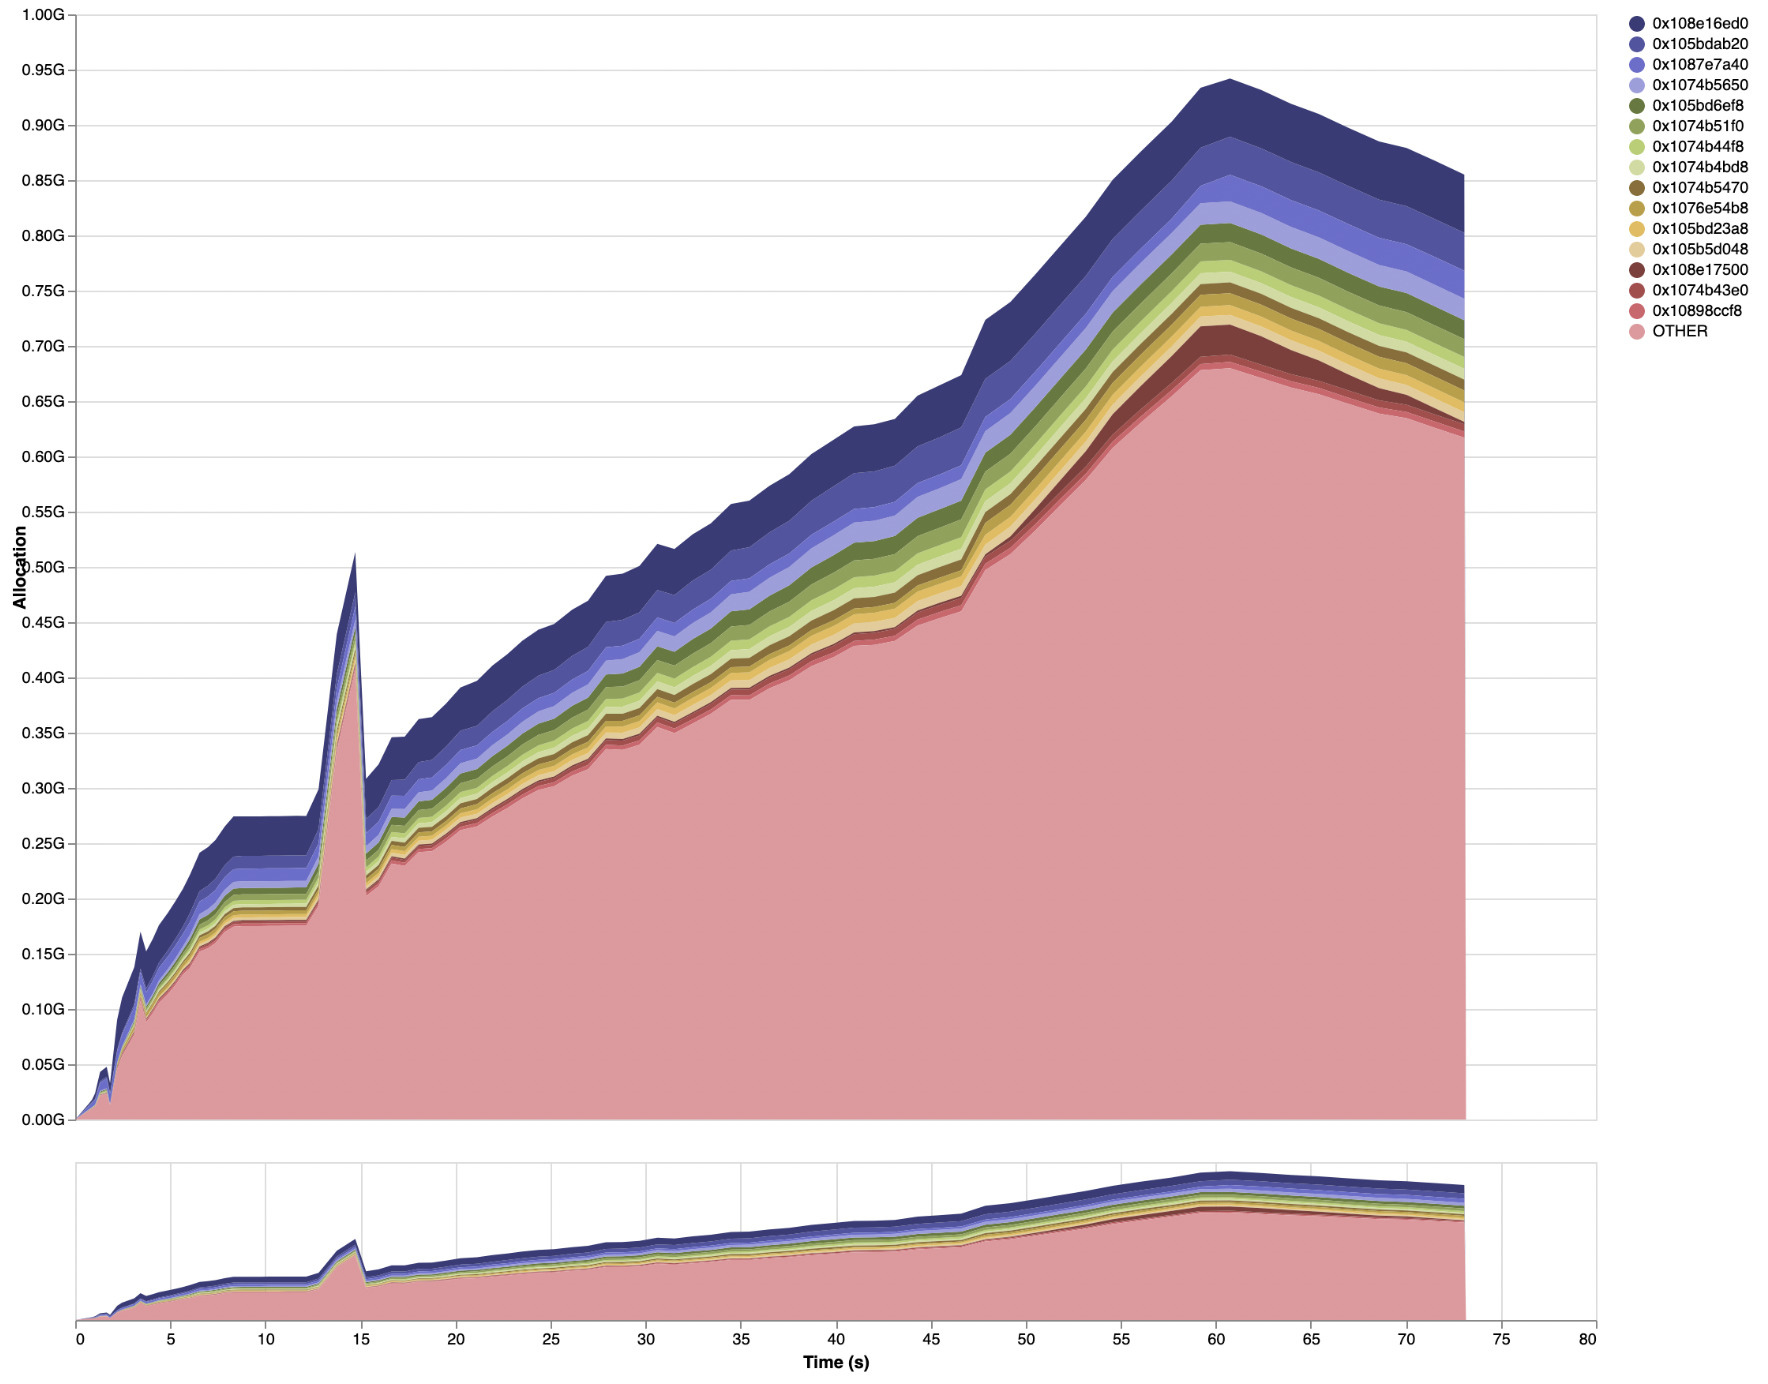
There are no more GRE closures dominating the profile in the “Detailed” tab:
Reducing memory usage the easy way
Answering difficult questions about a program’s memory usage will often lead to
optimization opportunities. This happened above when we essentially answered the
question of “what are these GRE constructors doing here?” In contrast, answering
easy questions can sometimes be just as productive. This is especially true for
Haddock, since it has been in development for over 15 years and has lots of dusty
corners in its source code as a result.
In essence, Haddock is a compiler that translates Haskell source code into an
intermediate representation and then into some documentation format (e.g. HTML
or LaTeX). The data structure Haddock uses as its intermediate representation
is the Interface type.
The core functions of Haddock are to generate Interface values from
Haskell modules using the GHC API, then to generate documentation from those Interface
values.
Going field by field through the Interface type and answering the
simple question of “what is this field used for?” led to many optimizations.
There were even fields of the Interface type that were being defined (and
thus allocated) but were never used. These fields could simply be removed
altogether.
A less trivial optimization also resulted from this process. Haddock is able to
generate a textual format that can be ingested and indexed by
Hoogle, the Haskell API search engine. One of
the fields of the Interface type (ifaceRnExportItems) was being used only to
generate these Hoogle files, and was being populated even if Hoogle
output was not requested. Additionally, the thunks being retained by this
field were disproportionately large for the results they were used to compute.
Instead we can generate the required values eagerly, only
when Hoogle output is requested.
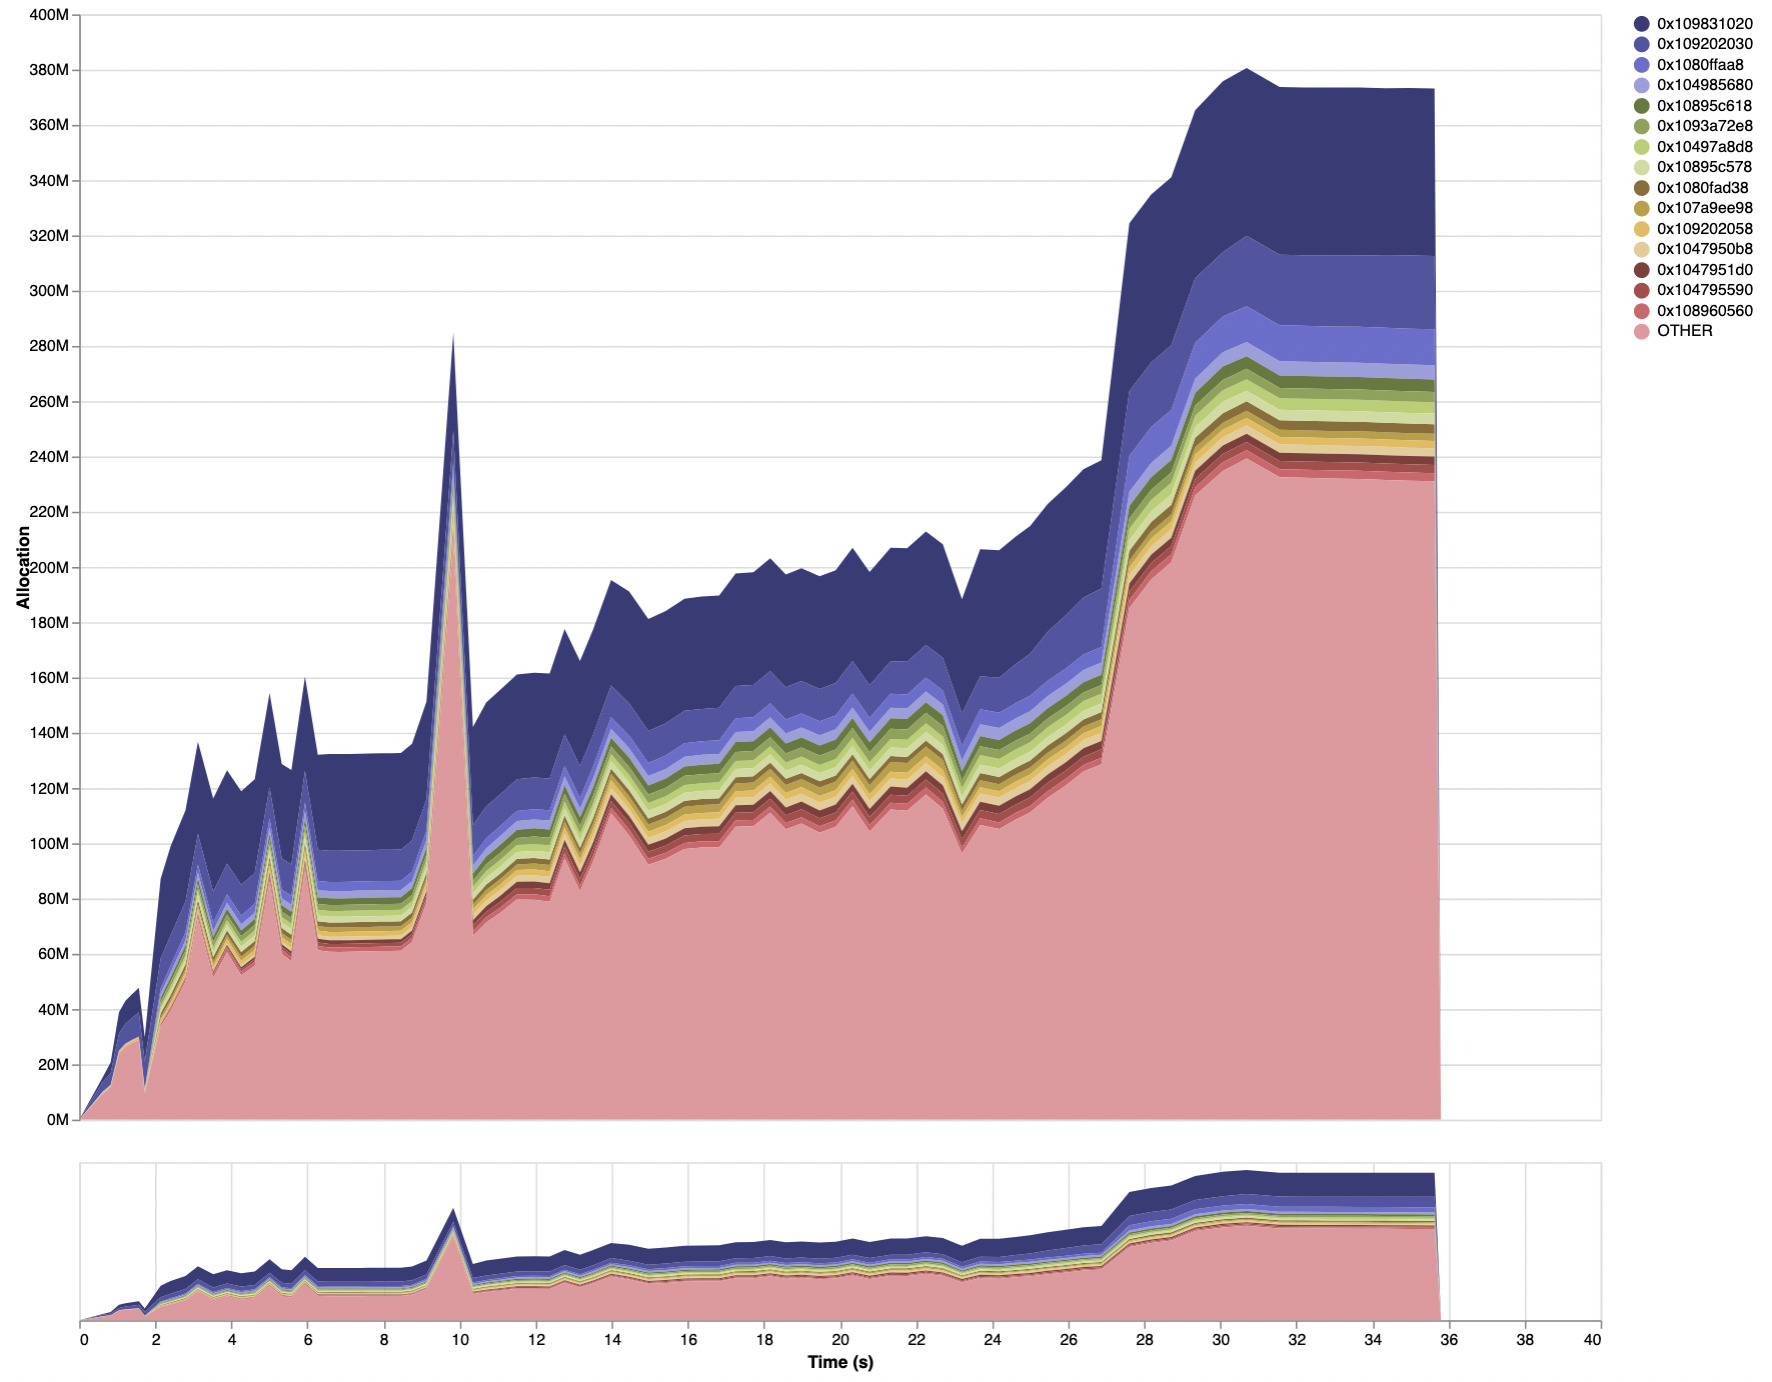
These changes resulted in another drastic decrease in Haddock’s memory usage.
With the patched GHC and Haddock,
peak live data residency on the Agda benchmark is now just over 550MB,
and the profile looks like
this (full eventlog2html output here):
Hi, Haddock!
Haddock was originally designed to type-check the source modules using the GHC API, then generate its intermediate representation directly from the results of type-checking. This had two significant downsides:
Even if the program has been compiled already, it must be type-checked again to generate documentation (and because of the need to execute Template Haskell splices, re-type-checking frequently implies full recompilation).
As we have seen, the results of type-checking contain far more information than is necessary to generate documentation alone.
The long-running “Hi Haddock” effort addressed this by fundamentally changing
the way Haddock works. Instead of generating documentation from the results of
type-checking, Haddock now uses the information available in the
interface files (.hi files) produced by GHC during compilation to describe the
interface of each module.
This fixed both of the issues listed above:
Once the program has been compiled, the information Haddock needs is already present in the
.hifiles and can be reused later. Moreover the existing recompilation avoidance mechanism can be used to decide whether subsequent compilation is necessary when source files have changed.The documentation structures stored in
.hifiles can be the minimal amount required by Haddock, avoiding the need to represent additional data in memory.
The Hi Haddock project was a major undertaking, originally started by Simon Jakobi in 2018 and with subsequent contributions from Alec Theriault, Hécate Moonlight and Zubin Duggal. As part of our work to reduce Haddock’s memory usage, Well-Typed finished off and landed the patch for Haddock (Haddock MR 1597). We’re grateful to everyone who contributed to the Hi Haddock work over the years.
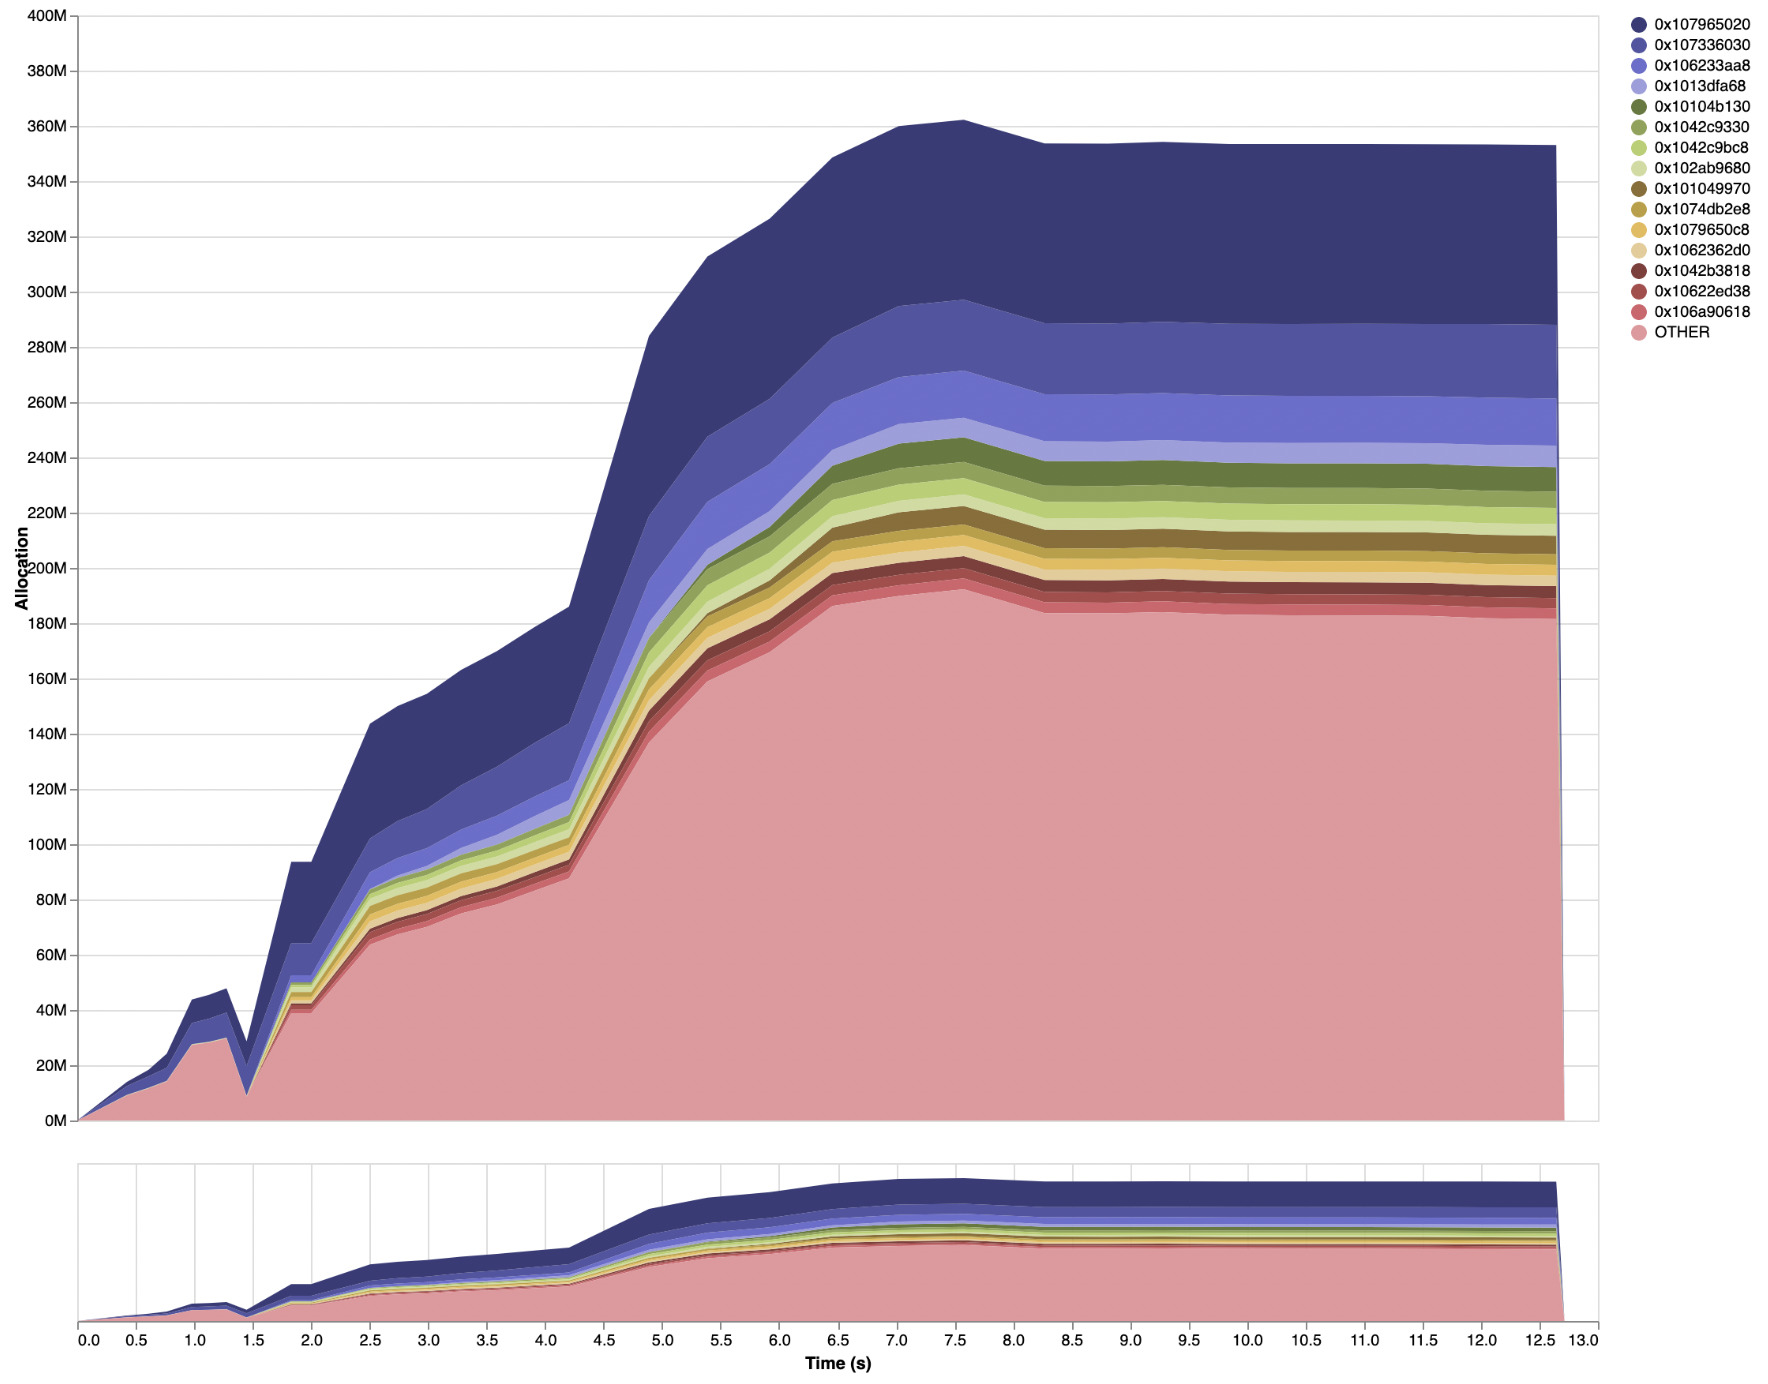
The performance impacts were very good. Adding the Hi Haddock changes on top of
the aforementioned patches resulted in a peak live data residency of only 380MB,
with the following profile (full eventlog2html output
here):
Moreover, when recompilation can be avoided because up-to-date compilation
results are available already, the memory usage is slightly lower but the time
taken drops significantly (full eventlog2html output
here):
Conclusion and future work
Thanks to this work, Haddock will use significantly less memory when
generating documentation. Many of these improvements were achieved as a result
of profiling Haddock using eventlog2html and
ghc-debug. On top of those improvements, we have landed the Hi Haddock changes
which resulted in additional performance gains.
The results presented in this blog post were captured while Haddock was running its default HTML-only mode, as this work was primarily focused on reducing the baseline memory usage of Haddock. Haddock has several backends and modes of operation that are likely ripe with more opportunity for both space and time optimizations.
Furthermore, more work is needed for users to be able to take full advantage of the benefits of Hi Haddock. It is currently very difficult to avoid recompilation during documentation generation when Haddock is executed through Cabal, as Cabal passes several flags to Haddock that always invalidate the previous build results. We are currently implementing the necessary changes to Cabal and Haddock to smooth out this interface (see Cabal MR 9177 and Haddock MR 38).
We are extremely grateful to Mercury for making this work on Haddock possible, and to all the Haddock maintainers and contributors. Thanks also to David Christiansen for feedback on a draft of this blog post.
Well-Typed is able to work on GHC, HLS, Cabal, Haddock and other core Haskell infrastructure thanks to funding from various sponsors. If your company might be able to contribute to this work, sponsor maintenance efforts, or fund the implementation of other features, please read about how you can help or get in touch.
The Agda codebase was chosen as a sample for this work because it is a large enough project that the phases of Haddock’s execution are apparent in the memory profile, and it uses a diverse set of Haskell language features that should result in significant coverage of Haddock’s code paths.↩︎
See this GHC wiki page for more information on the renamer.↩︎